
설명
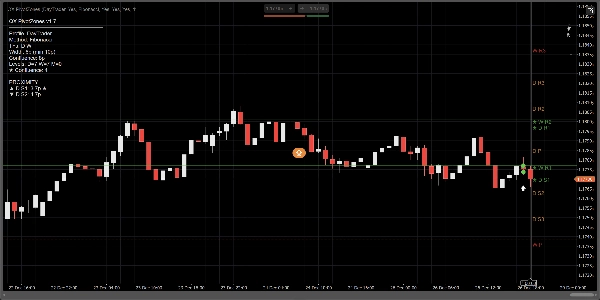
QX PivotZones는 단순히 가격이 무시하는 정적인 선이 아니라 실제 거래 결정을 위한 피벗 포인트 지표입니다"
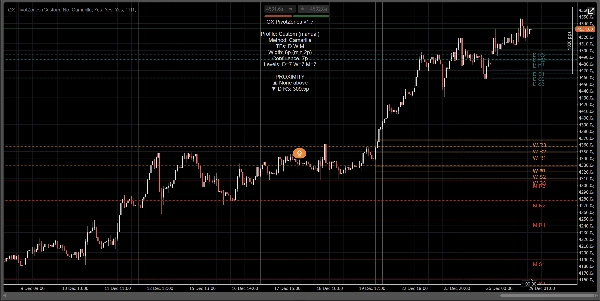
일간, 주간, 월간 피벗을 계산하며 클래식, 피보나치, 카마릴라 또는 우디 방식을 사용하고, 이를 조정 가능한 폭의 진짜 가격 구역(밴드)(핍 또는 ATR 기반)으로 표시합니다. 핵심 강점은 간단합니다: 자동으로 다중 타임프레임 합류를 강조하고 피벗을 실행 가능한 영역으로 바꾸며, “완벽한 선 환상”이 아닙니다.
일반적인 피보나치 피벗 / 피보포인트 도구와 다른 점:
대부분의 “피보포인트” 지표는 기본 피벗 선에서 멈춥니다. QX PivotZones는 트레이더가 실제로 필요한 것을 추가합니다:
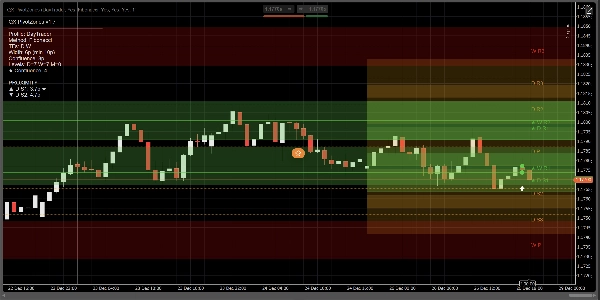
- 자동 D/W/M 합류 감지: 서로 다른 타임프레임의 피벗이 모일 때, 해당 레벨이 강조 표시(★)되고 합류 색상으로 칠해집니다.
- 얇은 선 대신 구역(밴드): 핍 또는 ATR로 폭을 정의합니다. 이는 “거의 닿음” 반응에서 오는 노이즈를 줄여줍니다.
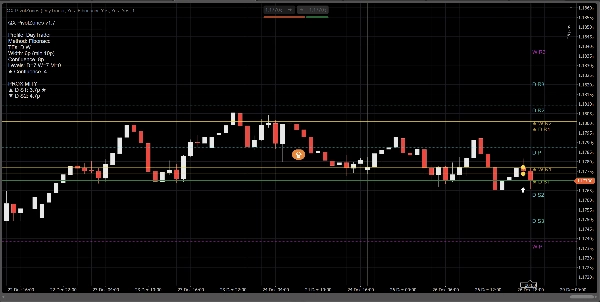
- 가장 가까운 레벨 필터 (선택 사항): 현재 가격 위아래에서 가장 관련성 높은 구역만 표시합니다.
- 유용한 알림: 구역 진입, 선 터치 또는 둘 다에 대해 트리거되며, 쿨다운과 선택적 “합류만” 필터링이 가능합니다.
- 정보 패널 + 근접성: 활성화된 TF, 방법, 구역 폭, 합류 수, 그리고 위/아래 가장 가까운 구역까지의 거리를 확인할 수 있습니다.
사용 방법:
1) 프로필 선택
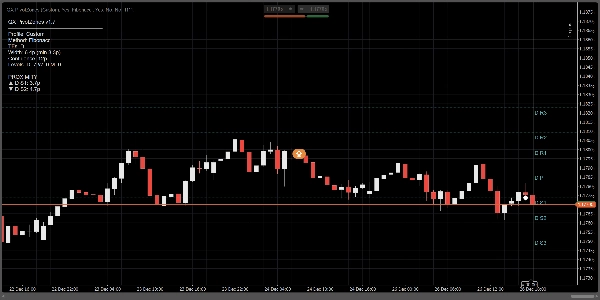
- 스캘퍼: 당일 거래, 적은 레벨, 더 좁은 적응형 구역.
- 데이 트레이더: 일간 + 주간 (기본값).
- 스윙: 일간 + 주간 + 월간.
- 사용자 정의: 모든 것을 수동으로 제어.
팁: “데이 트레이더 + 월간”을 원한다면 프로필 재정의를 비활성화하거나(또는 사용자 정의 사용) 월간 표시를 수동으로 활성화하세요.
2) 구역 구성 (핵심 부분)
아래에서 구역 폭 모드를 선택하세요:
- 핍: 고정되고 일관된 밴드용.
- ATR: 변동성에 적응하는 밴드용.
주요 매개변수:
- 구역 폭 (핍) 또는 ATR k
- 최소 구역 폭 (핍): 밴드가 너무 얇아지는 것을 방지합니다.
- 구역 채우기: 구역을 칠합니다.
- 오른쪽으로 구역 확장: 밴드를 보이는 오른쪽 영역으로 투사합니다.
3) 합류 활성화 (주요 차별점)
- 합류 강조: 켬
- 합류 모드:
-
- 핍: 고정 허용 오차용
- ATR: 적응 허용 오차용
- 합류 거리 또는 합류 ATR k
합류된 레벨은 다음을 갖습니다:
- 합류 색상
- ★ 표시가 라벨에
- 패널에 표시된 개수
4) 알림 (화면을 계속 보지 않고 거래)
- 알림: 구역 진입, 선 터치, 또는 둘 다
- 알림: 합류만: 노이즈 감소
- 알림 쿨다운 (바): 스팸 방지
- 알림 아이콘 표시: 차트에 이벤트 표시
빠른 설정 프리셋 (권장)
스캘핑 (M5–M15)
- 구역 폭 모드: ATR
- ATR k: 0.15–0.25
- 합류 모드: 핍
- 합류 거리: 4–8 핍
- 가장 가까운 구역만: 켬 (위 3개 / 아래 3개)
데이 트레이딩 (M15–H1)
- 구역 폭 모드: 핍
- 폭: 6–10 핍
- 합류: 8–12 핍
- 활성화 일간 + 주간
스윙 (H4–D1)
- 구역 폭 모드: ATR
- ATR k: 0.25–0.45
- 활성화 일간 + 주간 + 월간
기능 및 비기능
- 이것은 매수/매도 신호 생성기가 아닙니다.
- 이는 시장 구조 / 지지 및 저항 구역 지도이며 이벤트 알림(진입/터치)과 합류 강조를 제공합니다.
- 최고의 사용 사례: 피벗에서의 반응, 거부/수용, 되돌림, 목표, 분할 청산, 거래 보호.
요약
지표 프로필
고객 리뷰
5.0
리뷰: 1
5 | 100 % | |
4 | 0 % | |
3 | 0 % | |
2 | 0 % | |
1 | 0 % |
고객 리뷰
December 29, 2025
tbh it is not magic, just a decent extra filter. It should not replace the chart.
상담
자주 묻는 질문(FAQ)
Signal
Indices
Commodities
GBPUSD
RSI
Bollinger
Fibonacci
Scalping
AI
XAUUSD
NAS100
MACD
BTCUSD
Forex
Breakout
EURUSD
NZDUSD
Prop
ZigZag
Supertrend
Fair Value Gap
SMC
Crypto
Grid
Stocks
ATR
USDJPY
VWAP
트레이딩 봇, 지표, 플러그인 등 cTrader Store에서 제공되는 상품은 제3자 개발자에 의해 제공되며, 이는 단순히 정보 및 기술적 접근을 목적으로 제공된 것입니다. cTrader Store는 중개인이 아니며, 투자 조언, 개인별 추천 또는 향후 성과에 대한 어떠한 보장도 제공하지 않습니다.


!["High-Low Divergence [Iridio Capital]" 로고](https://cdn.ctrader.com/image/webp/443c4661-7abb-40f1-842f-4b6ec560649b_40914)


가격
41.97M
거래량
208.53K
핍 수익
13
판매
361
무료 설치