
Descrizione
QX Candle Pressure Index è un indicatore di pressione delle candele per cTrader che aiuta i trader a leggere con quanta forza ogni candela si chiude all'interno del proprio intervallo.
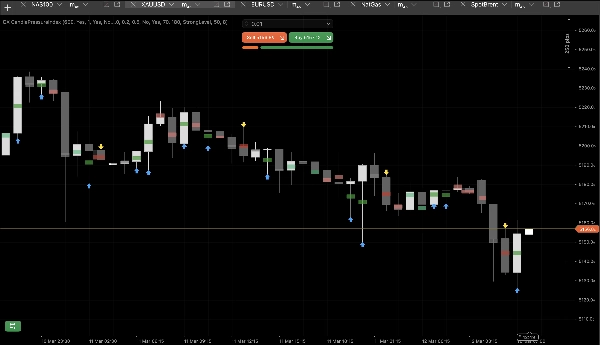
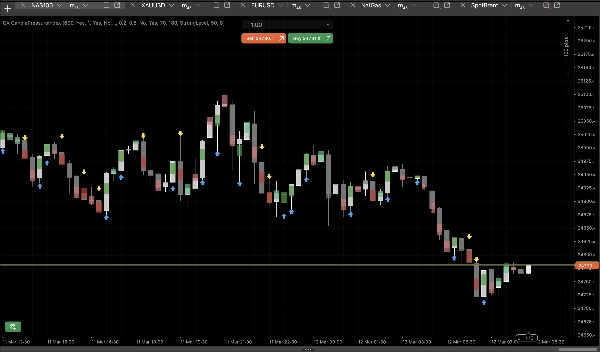
Invece di utilizzare una finestra separata per l'oscillatore, CPI mostra la pressione direttamente sul grafico principale tramite marcatori compatti al punto medio. Questo rende più facile leggere la forza di chiusura, il bias rialzista o ribassista e il momentum a breve termine con meno rumore visivo.
Principali utilizzi
CPI è progettato per aiutare i trader a:
- valutare la qualità della chiusura della candela
- confermare la pressione direzionale
- valutare la forza del breakout
- leggere più chiaramente i pullback
- individuare prima i cambiamenti di momentum
Come funziona
Ogni candela viene classificata in base a dove si chiude all'interno del proprio intervallo:
- vicino al massimo = pressione rialzista
- vicino al minimo = pressione ribassista
- vicino al centro = pressione neutra
Queste informazioni vengono visualizzate utilizzando:
- marcatori di pressione al punto medio
- 5 zone di pressione
- frecce opzionali per pressione forte
- overlay opzionale sul corpo
Zone di pressione
CPI suddivide le candele in 5 stati visivi:
- Acquisto forte
- Acquisto moderato
- Neutro
- Vendita moderata
- Vendita forte
Questo aiuta i trader a identificare se un movimento è forte, debole o equilibrato.
Caratteristiche principali
Marcatori di pressione al punto medio
Marcatori visivi compatti ancorati al punto medio della candela.
5 zone di pressione
Chiara separazione tra chiusure forti, moderate e neutre.
Ignora barra in formazione
Ignora la candela in tempo reale fino alla chiusura per letture più stabili.
Nascondi marcatori neutri
Mantiene il grafico più pulito mostrando solo le candele direzionali.
Modalità frecce
Evidenzia visivamente le candele forti rialziste o ribassiste.
Overlay sul corpo
Aggiunge un sottile strato extra per facilitare la lettura del grafico.
Parametri principali e come usarli
Disegna barre indietro
Controlla quante candele passate vengono mostrate.
Ignora barra in formazione
Attiva per lettura a barra chiusa e segnali più stabili.
Soglia moderata
Definisce quando una candela smette di essere neutra.
Soglia forte
Definisce quando la pressione diventa forte.
Nascondi marcatori neutri
Usa per una visualizzazione direzionale più pulita.
Modalità freccia
Scegli tra nessuna freccia, frecce su ogni candela forte o frecce solo sui forti cambiamenti.
Scala / larghezza / opacità del marcatore
Regola l'aspetto visivo per adattarlo al tuo stile di grafico.
Ideale per
- conferma della continuazione del trend
- valutazione della qualità del breakout
- analisi dei pullback
- lettura del momentum a breve termine
- interpretazione più pulita dell'azione del prezzo
Sintesi
QX Candle Pressure Index è uno strumento visivo pulito per i trader che vogliono leggere la pressione delle candele direttamente sul grafico, senza aggiungere un altro pannello indicatore.
Riepilogo
Recensioni dei clienti
5 | 50 % | |
4 | 50 % | |
3 | 0 % | |
2 | 0 % | |
1 | 0 % |


