
QX MatrixHybrid
Indicatore
Versione 1.0, Feb 2026
Windows, Mac
4.6
Recensioni: 3
Descrizione
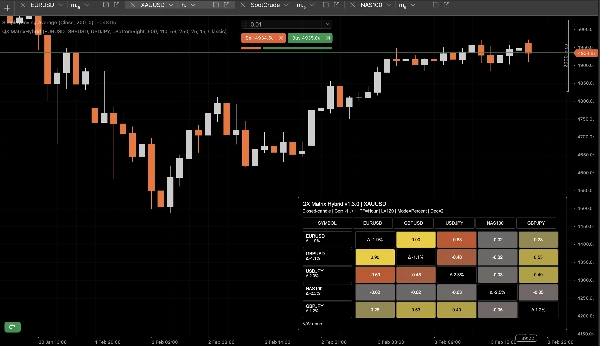
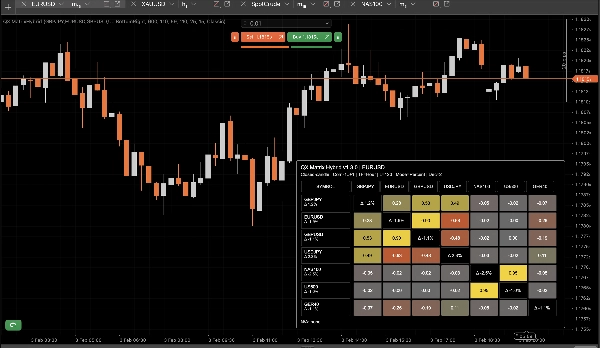
QX Matrix Hybrid è un indicatore visivo che mostra una matrice di correlazione multi-asset come un pannello heatmap pulito. Ti aiuta a identificare istantaneamente quali strumenti si muovono insieme, quali si muovono in modo inverso e dove potresti duplicare involontariamente l'esposizione tra i mercati.
Caratteristiche principali
- Matrice di correlazione (-1 a +1) utilizzando correlazione di Pearson tra i simboli.
- Modalità di rendimento:
-
- Rendimenti percentuali
- Rendimenti logaritmici
- Forza (Δ%) per simbolo: mostra la performance di ogni simbolo nel periodo di riferimento (nelle etichette di riga e opzionalmente sulla diagonale).
- Contrasto automatico del testo: il colore del testo si adatta alla luminanza dello sfondo per la leggibilità.
- Temi + tavolozza personalizzata: molteplici preset più controlli completi per la selezione dei colori personalizzati.
- Layout del pannello flessibile: ancoraggio agli angoli, larghezza, dimensione delle celle, margini, controllo dell'altezza delle righe.
- Footer intelligente: elenca i simboli mancanti/non disponibili con troncamento configurabile.
Prestazioni e logica di aggiornamento
Progettato per rimanere reattivo anche con più simboli:
- Caching per simbolo di oggetti Symbol e Bars per evitare chiamate API ripetitive.
- Invalidazione automatica della cache quando Symbols CSV o TimeFrame cambiano.
- Solo candele chiuse modalità per minimizzare il carico della CPU (aggiornamenti su nuove barre chiuse).
- Opzionale Throttle di aggiornamento (ms) per la modalità live.
Come usarlo
- +1.00: forte co-movimento positivo (alta ridondanza).
- 0.00: bassa relazione (potenziale diversificazione).
- -1.00: forte relazione inversa (possibile copertura).
Usa la matrice per ridurre la sovrapposizione correlata, trovare coppie di copertura e comprendere i “cluster” di mercato tra FX, indici, metalli, criptovalute, ecc.
Parametri (livello alto)
- Symbols CSV, TimeFrame, Lookback
- Modalità di rendimento (Percentuale/Log), Decimali, Decimali automatici su Log
- Solo candele chiuse, Throttle di aggiornamento
- Mostra forza (Δ%), Mostra footer, Footer max mancanti
- Layout del pannello (angolo, larghezza, dimensioni celle, margine)
- Colori / Tema (inclusa tavolozza personalizzata)
Note
- Solo visualizzazione. Non vengono effettuati ordini.
- I simboli possono mostrare N/A se non disponibili sul tuo broker/server o se non c'è abbastanza storico per il timeframe/lookback selezionato.
Riepilogo
Riepilogo AI
QX MatrixHybrid is a real-time visual indicator that presents a multi-asset correlation matrix as a heatmap panel. It displays Pearson correlation coefficients ranging from -1 to +1 between up to 12 selected symbols, helping users identify strong positive correlations, inverse relationships, and low correlations for diversification or hedging purposes. The indicator supports multiple return modes, including percent and log returns, and tracks each symbol’s performance over a configurable lookback period, showing strength as percentage change.
The interface offers full customization with multiple color themes and a custom palette, adjustable panel layout options (such as docking, cell size, and margins), and automatic text contrast for readability. It includes a smart footer that lists missing or unavailable symbols with configurable truncation.
Performance optimizations include per-symbol caching to reduce API calls, automatic cache invalidation on symbol or timeframe changes, and a "Closed Candle Only" mode to minimize CPU load by updating only on new closed bars. An optional update throttle controls live update frequency.
QX MatrixHybrid is designed for use across various markets including forex, indices, commodities, metals, and cryptocurrencies. It is a visualization tool only and does not place orders. Symbols may show as unavailable if data is insufficient or missing.
Profilo indicatore
Recensioni dei clienti
4.6
Recensioni: 3
5 | 67 % | |
4 | 33 % | |
3 | 0 % | |
2 | 0 % | |
1 | 0 % |
Recensioni dei clienti
February 12, 2026
The part that matters is bad ideas get easier to avoid, and 20 signals is a fair first sample.
February 9, 2026
Two sessions say more than one clean chart, and weak ideas are easier to skip.
February 5, 2026
Ngl, weak ideas are easier to skip and that is enough to keep testing it. Price action still has to agree.
Discussioni
Domande frequenti
Signal
Indices
Commodities
GBPUSD
RSI
Bollinger
Fibonacci
Scalping
AI
XAUUSD
NAS100
MACD
BTCUSD
Forex
Breakout
EURUSD
NZDUSD
Martingale
Prop
ZigZag
Supertrend
Fair Value Gap
SMC
Crypto
Grid
Stocks
ATR
USDJPY
VWAP
I prodotti disponibili tramite cTrader Store, inclusi bot di trading, indicatori e plugin, sono forniti da sviluppatori terzi e resi disponibili esclusivamente a scopo informativo e di accesso tecnico. cTrader Store non è un broker e non fornisce consulenze in materia di investimento, raccomandazioni individualizzate o garanzie di risultati futuri.


![Logo di "[Stellar Strategies] Inside Bar with Signals"](https://cdn.ctrader.com/image/webp/1d9e8bfa-3b2c-4440-bb37-5856902008a7_30683)


Prezzo
41.97M
Volume negoziato
208.53K
Profitto in pip
13
Vendite
353
Installazioni gratuite