
Описание
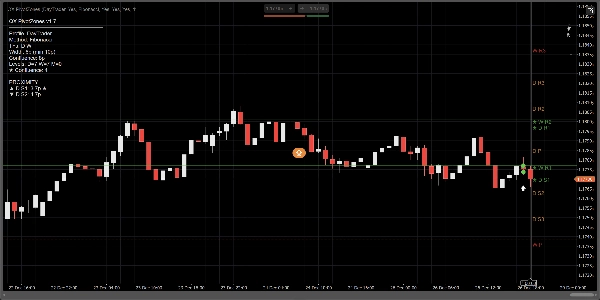
QX PivotZones — это индикатор Pivot Points, созданный для реальных торговых решений, а не просто статичных линий, которые цена игнорирует"
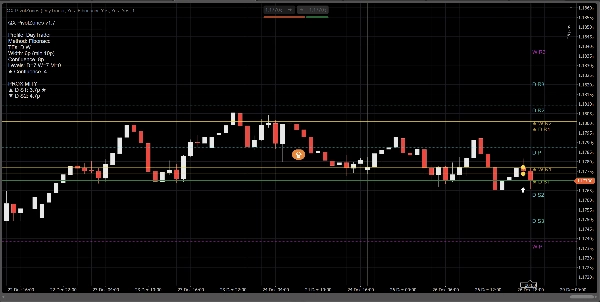
Он рассчитывает ежедневные, еженедельные и ежемесячные уровни с использованием классического, Фибоначчи, Камариллы или Вуди методов и отображает их как настоящие ценовые зоны (полосы) с регулируемой шириной (пипсы или на основе ATR). Основное преимущество простое: он автоматически выделяет мультивременную конвергенцию и превращает уровни в практические зоны, а не в «фантазии о идеальных линиях».
Чем он отличается от типичных инструментов Fibonacci Pivot / FiboPoints:
Большинство индикаторов «FiboPoints» ограничиваются базовыми линиями пивотов. QX PivotZones добавляет то, что действительно нужно трейдерам:
- Автоматическое обнаружение конвергенции D/W/M: когда пивоты с разных таймфреймов сходятся, уровень выделяется (★) и окрашивается цветом конвергенции.
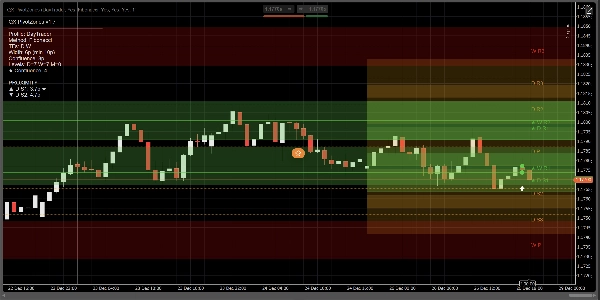
- Зоны (полосы) вместо тонких линий: задайте ширину в пипсах или ATR. Это снижает шум от реакций «почти касания».
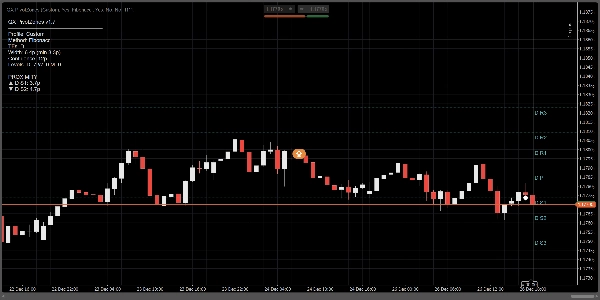
- Фильтр ближайших уровней (опционально): показывать только самые релевантные зоны выше и ниже текущей цены.
- Полезные оповещения: срабатывают при входе в зону, касании линии или обоих событиях, с кулдауном и опциональной фильтрацией «только конвергенция».
- Информационная панель + близость: отображает включённые таймфреймы, метод, ширину зоны, количество конвергенций и расстояние до ближайшей зоны сверху/снизу.
Как использовать:
1) Выберите профиль
- Скальпер: внутридневной, меньше уровней, более узкие адаптивные зоны.
- Дейтрейдер: ежедневные + еженедельные (по умолчанию).
- Свинг: ежедневные + еженедельные + ежемесячные.
- Пользовательский: ручное управление всеми параметрами.
Совет: если хотите «Дейтрейдер + Ежемесячные», отключите переопределения профиля (или используйте Пользовательский) и вручную включите Показать ежемесячные.
2) Настройте зоны (вот в чём суть)
В разделе Режим ширины зоны:
- Пипсы для фиксированных, постоянных полос.
- ATR для полос, адаптирующихся к волатильности.
Ключевые параметры:
- Ширина зоны (пипсы) или коэффициент ATR
- Мин. ширина зоны (пипсы) чтобы полосы не становились слишком тонкими
- Заливка зон для окрашивания зон
- Продлить зоны вправо для проецирования полос на видимую правую часть
3) Включите конвергенцию (главное отличие)
- Выделять конвергенцию: ВКЛ
- Режим конвергенции:
-
- Пипсы для фиксированной толерантности
- ATR для адаптивной толерантности
- Расстояние конвергенции или коэффициент ATR для конвергенции
Конвергентные уровни получают:
- цвет конвергенции
- ★ маркер на метке
- Отображение количества в панели
4) Оповещения (торгуйте, не уставившись в экран)
- Оповещения: вход в зону, касание линии или оба варианта
- Оповещения: только конвергенция: уменьшает шум
- Кулдаун оповещений (бары): предотвращает спам
- Отображать иконки оповещений: отмечает события на графике
Быстрые пресеты настройки (рекомендуемые)
Скальпинг (M5–M15)
- Режим ширины зоны: ATR
- Коэффициент ATR: 0.15–0.25
- Режим конвергенции: Пипсы
- Расстояние конвергенции: 4–8 пипсов
- Только ближайшие зоны: ВКЛ (3 сверху / 3 снизу)
Дейтрейдинг (M15–H1)
- Режим ширины зоны: Пипсы
- Ширина: 6–10 пипсов
- Конвергенция: 8–12 пипсов
- Включить ежедневные + еженедельные
Свинг (H4–D1)
- Режим ширины зоны: ATR
- Коэффициент ATR: 0.25–0.45
- Включить ежедневные + еженедельные + ежемесячные
Что он делает (и чего не делает)
- Это не генератор сигналов на покупку/продажу.
- Это карта рыночной структуры / зон поддержки и сопротивления с событийными оповещениями (вход/касание) и выделением конвергенций.
- Лучшие случаи использования: реакции на пивотах, отторжение/принятие, откаты, цели, частичное закрытие позиций и защита сделок.
Сводка
Отзывы покупателей
5 | 100 % | |
4 | 0 % | |
3 | 0 % | |
2 | 0 % | |
1 | 0 % |


