
QX SessionBox ORB
Индикатор
4 покупки
Версия 1.0, Dec 2025
Windows, Mac
5.0
Отзывы: 2
Описание
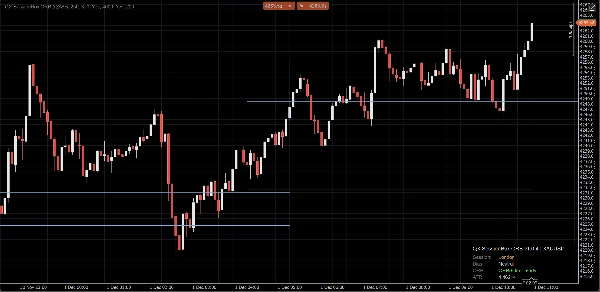
QX SessionBox ORB — это чистый оверлей сессии + Opening Range (ORB) для cTrader.
Он выделяет Азию, Лондон и Нью-Йорк с минимальным загромождением графика, строит Opening Range за первые X минут и сохраняет уровни ORB High/Low видимыми как объективную внутридневную структуру. Компактная панель показывает статус сессии и направление, чтобы вы могли прочитать контекст за секунды.
Что вы получаете
- Боксы сессий Азия / Лондон / Нью-Йорк (пользовательские временные диапазоны + цвета)
- Opening Range (ORB) за первые ORB Minutes
- Линии ORB High / ORB Low (пользовательский цвет, ширина и стиль)
- Опциональный ORB бокс (выделение диапазона)
- Компактная панель управления (статус сессии, ORB, направление, ATR)
- Опциональные подтверждения пробоя (только закрытая свеча, стабильно)
Опциональный продвинутый режим
- Поддержка перекрывающихся сессий (опционально)
-
- Рисовать несколько боксов сессий, когда времена сессий перекрываются
- Основная сессия управляет панелью, сигналами и опорными линиями ORB (настраивается)
Как использовать (простой рабочий процесс)
- Прикрепите QX SessionBox ORB к вашему графику.
- Установите Session UTC Offset в соответствии с вашими желаемыми часами сессии.
- Выберите ORB Minutes (обычно: 15, 30, 60).
- Пока ORB строится, панель показывает строится. После этого она становится готова.
- Используйте уровни ORB как структуру:
-
- Цена выше ORB High: бычье давление на сессию
- Цена ниже ORB Low: медвежье давление на сессию
- Цена внутри ORB: поведение в диапазоне (важен контекст)
- (Опционально) Включите Отображение сигналов:
-
- CrossOnly (по умолчанию): свеча закрывается за пределами границы ORB
- State: подтверждает, когда цена переходит в бычье/медвежье состояние
- (Опционально) Включите ATR Фильтр для уменьшения слабых пробоев (ATR k — ваш основной регулятор чувствительности).
Разработано для реальных графиков
- Логика закрытой свечи для стабильности и ясности (без мерцания внутри бара)
- Ограниченные обновления для снижения нагрузки на ЦП
- Сохранять последние сессии чтобы избежать загромождения
- Загрузка истории опция для быстрого заполнения последних сессий
- Чистое поведение правого края (без трюков растяжения графика)
Примечания
- Это визуальный инструмент поддержки принятия решений. Он не совершает сделки и не является финансовой консультацией.
- Сессии используют UTC + ручной сдвиг (без автоматического перехода на летнее время).
- Длина исторического отображения контролируется Bootstrap Bars и Keep Last Sessions.
- «Видеть сессию. Отметить диапазон. Торговать пробой с ясностью.»
Основные параметры (кратко)
- ORB Minutes: длина окна opening range
- Цвет / ширина / стиль линии ORB: внешний вид ORB High/Low
- Использовать ATR фильтр + ATR k: контроль строгости пробоя
- Режим сигнала: CrossOnly (чистый) или State (более визуальный)
- Разрешить перекрывающиеся сессии: несколько боксов сессий при перекрытии времени
- Сохранять последние сессии: сколько прошлых сессий остается на графике
- Ограничение обновлений (мс): баланс производительности и отзывчивости
Сводка
ИИ-сводка
QX SessionBox ORB is an indicator for cTrader that visually overlays trading sessions and Opening Range Breakout (ORB) levels on price charts. It highlights the Asia, London, and New York sessions with customizable time ranges and colors, minimizing chart clutter. The indicator builds the Opening Range for a user-defined number of minutes and displays ORB High and Low lines as key intraday structure levels, with adjustable appearance settings.
A compact dashboard panel provides real-time session status, ORB readiness, bias, and Average True Range (ATR) information for quick context assessment. Optional features include an ORB range highlight box, closed-candle breakout confirmation signals, and an ATR filter to reduce false breakouts. An advanced mode supports overlapping sessions, allowing multiple session boxes to display when session times overlap, with configurable primary session control.
Designed for stability and efficiency, QX SessionBox ORB uses closed-candle logic to avoid intrabar flicker, throttled updates for lower CPU usage, and options to keep a set number of past sessions visible. Users set session UTC offsets manually and can customize parameters such as ORB minutes, signal modes, and update frequency. The tool serves as a visual decision-support aid for intraday breakout trading across various markets including Forex, indices, commodities, and cryptocurrencies.
Профиль индикатора
Отзывы покупателей
5.0
Отзывы: 2
5 | 100 % | |
4 | 0 % | |
3 | 0 % | |
2 | 0 % | |
1 | 0 % |
Обсуждение
Частые вопросы
BTCUSD
Forex
Signal
Breakout
Indices
EURUSD
Commodities
GBPUSD
NZDUSD
RSI
Bollinger
Fibonacci
Scalping
Grid
Stocks
AI
XAUUSD
NAS100
ATR
USDJPY
VWAP
Продукты, доступные в cTrader Store, включая торговых ботов, индикаторы и плагины, предоставляются сторонними разработчиками и доступны исключительно в информационных и технических целях. cTrader Store не является брокером и не предоставляет инвестиционные консультации, персональные рекомендации или какие-либо гарантии будущей доходности.


Цена
41.97M
Торгуемый объем
208.53K
Выигранные пипы
14
Продажи
362
Бесплатные установки