
Description
QX Candle Pressure Index est un indicateur de pression des chandeliers pour cTrader qui aide les traders à lire la force avec laquelle chaque chandelier se ferme dans sa propre plage.
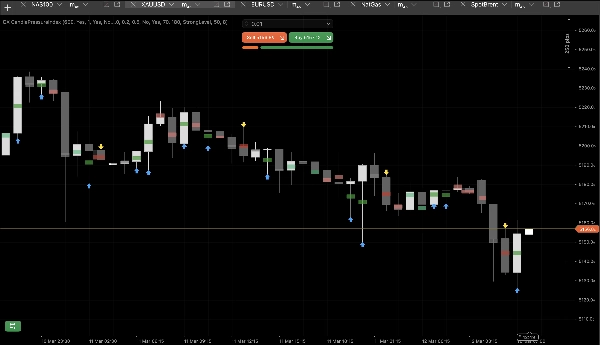
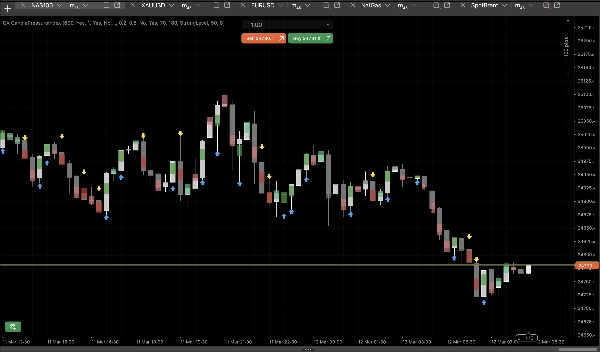
Au lieu d'utiliser une fenêtre d'oscillateur séparée, le CPI affiche la pression directement sur le graphique principal via des marqueurs compacts au point médian. Cela facilite la lecture de la force de clôture, du biais haussier ou baissier, et du momentum à court terme avec moins de bruit visuel.
Principales utilisations
Le CPI est conçu pour aider les traders à :
- évaluer la qualité de la clôture du chandelier
- confirmer la pression directionnelle
- évaluer la force d'une cassure
- lire plus clairement les replis
- détecter plus tôt les changements de momentum
Comment ça fonctionne
Chaque chandelier est classé selon l'endroit où il se ferme dans sa propre plage :
- près du plus haut = pression haussière
- près du plus bas = pression baissière
- près du milieu = pression neutre
Cette information est affichée en utilisant :
- des marqueurs de pression au point médian
- 5 zones de pression
- des flèches optionnelles pour une forte pression
- un calque optionnel sur le corps
Zones de pression
Le CPI sépare les chandeliers en 5 états visuels :
- Achat fort
- Achat modéré
- Neutre
- Vente modérée
- Vente forte
Cela aide les traders à identifier si un mouvement est fort, faible ou équilibré.
Principales caractéristiques
Marqueurs de pression au point médian
Marqueurs visuels compacts ancrés au point médian du chandelier.
5 zones de pression
Séparation claire entre clôtures fortes, modérées et neutres.
Ignorer la barre en formation
Ignore le chandelier en cours jusqu'à sa clôture pour des lectures plus stables.
Masquer les marqueurs neutres
Garde le graphique plus propre en affichant uniquement les chandeliers directionnels.
Modes de flèches
Met en évidence visuellement les chandeliers haussiers ou baissiers forts.
Calque sur le corps
Ajoute une couche subtile supplémentaire pour faciliter la lecture du graphique.
Principaux paramètres et comment les utiliser
Afficher les barres passées
Contrôle le nombre de chandeliers passés affichés.
Ignorer la barre en formation
Activez pour une lecture sur barre clôturée et des signaux plus stables.
Seuil modéré
Définit quand un chandelier cesse d'être neutre.
Seuil fort
Définit quand la pression devient forte.
Masquer les marqueurs neutres
Utilisez pour une vue directionnelle plus épurée.
Mode flèche
Choisissez entre pas de flèches, flèches sur chaque chandelier fort, ou flèches uniquement sur les transitions fortes.
Échelle / largeur / opacité des marqueurs
Ajustez l'apparence visuelle pour correspondre à votre style de graphique.
Meilleure utilisation pour
- confirmation de la continuation de tendance
- évaluation de la qualité d'une cassure
- analyse des replis
- lecture du momentum à court terme
- interprétation plus claire de l'action des prix
Résumé
QX Candle Pressure Index est un outil visuel épuré pour les traders qui souhaitent lire la pression des chandeliers directement sur le graphique, sans ajouter une autre fenêtre d'indicateur.
Résumé
Avis clients
5 | 50 % | |
4 | 50 % | |
3 | 0 % | |
2 | 0 % | |
1 | 0 % |


