
QX MatrixHybrid
Indicateur
Version 1.0, Feb 2026
Windows, Mac
4.6
Avis : 3
Description
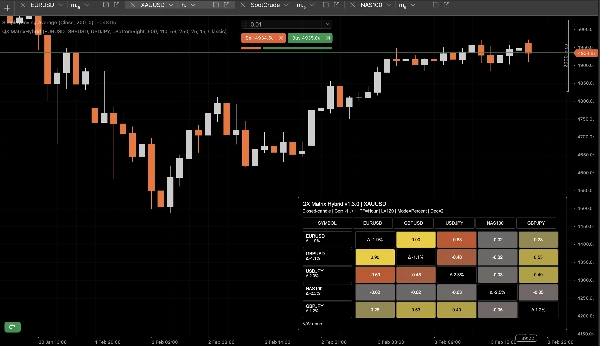
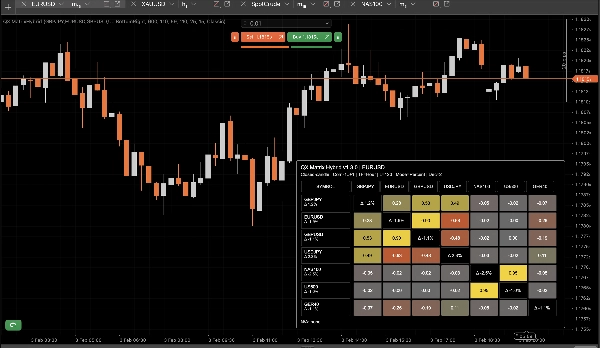
QX Matrix Hybrid est un indicateur visuel qui affiche une matrice de corrélation multi-actifs sous forme d’un panneau heatmap épuré. Il vous aide à identifier instantanément quels instruments évoluent ensemble, lesquels évoluent de manière inverse, et où vous pourriez dupliquer involontairement votre exposition sur plusieurs marchés.
Caractéristiques principales
- Matrice de corrélation (-1 à +1) utilisant la corrélation de Pearson entre les symboles.
- Mode de rendement :
-
- Rendements en pourcentage
- Rendements logarithmiques
- Force (Δ%) par symbole : montre la performance de chaque symbole sur la fenêtre d’analyse (dans les étiquettes de ligne et éventuellement sur la diagonale).
- Contraste automatique du texte : la couleur du texte s’adapte à la luminance de l’arrière-plan pour une meilleure lisibilité.
- Thèmes + palette personnalisée : plusieurs préréglages ainsi que des contrôles complets de sélection de couleurs personnalisées.
- Disposition flexible du panneau : ancrage dans un coin, largeur, taille des cellules, marges, contrôle de la hauteur des lignes.
- Pied de page intelligent : liste les symboles manquants/non disponibles avec troncature configurable.
Performance et logique de mise à jour
Conçu pour rester réactif même avec plusieurs symboles :
- Mise en cache par symbole des objets Symbol et Bars pour éviter les appels API répétitifs.
- Invalidation automatique du cache lorsque le CSV des symboles ou le TimeFrame changent.
- Mode bougie fermée uniquement pour minimiser la charge CPU (mises à jour sur nouvelles barres fermées).
- Optionnel limiteur de mise à jour (ms) pour le mode en direct.
Comment l’utiliser
- +1.00 : co-mouvement positif fort (forte redondance).
- 0.00 : faible relation (diversification potentielle).
- -1.00 : forte relation inverse (couverture possible).
Utilisez la matrice pour réduire les chevauchements corrélés, trouver des paires de couverture et comprendre les « clusters » du marché à travers le FX, les indices, les métaux, la crypto, etc.
Paramètres (niveau élevé)
- CSV des symboles, TimeFrame, Fenêtre d’analyse
- Mode de rendement (Pourcentage/Log), Décimales, Décimales automatiques sur Log
- Bougie fermée uniquement, Limiteur de mise à jour
- Afficher la force (Δ%), Afficher le pied de page, Max symboles manquants au pied de page
- Disposition du panneau (coin, largeur, tailles des cellules, marge)
- Couleurs / Thème (y compris palette personnalisée)
Notes
- Visualisation uniquement. Aucun ordre n’est passé.
- Les symboles peuvent afficher N/A si non disponibles chez votre courtier/serveur ou s’il n’y a pas assez d’historique pour le timeframe/fenêtre d’analyse sélectionné.
Résumé
Résumé IA
QX MatrixHybrid is a real-time visual indicator that presents a multi-asset correlation matrix as a heatmap panel. It displays Pearson correlation coefficients ranging from -1 to +1 between up to 12 selected symbols, helping users identify strong positive correlations, inverse relationships, and low correlations for diversification or hedging purposes. The indicator supports multiple return modes, including percent and log returns, and tracks each symbol’s performance over a configurable lookback period, showing strength as percentage change.
The interface offers full customization with multiple color themes and a custom palette, adjustable panel layout options (such as docking, cell size, and margins), and automatic text contrast for readability. It includes a smart footer that lists missing or unavailable symbols with configurable truncation.
Performance optimizations include per-symbol caching to reduce API calls, automatic cache invalidation on symbol or timeframe changes, and a "Closed Candle Only" mode to minimize CPU load by updating only on new closed bars. An optional update throttle controls live update frequency.
QX MatrixHybrid is designed for use across various markets including forex, indices, commodities, metals, and cryptocurrencies. It is a visualization tool only and does not place orders. Symbols may show as unavailable if data is insufficient or missing.
Profil de l'indicateur
Avis clients
4.6
Avis : 3
5 | 67 % | |
4 | 33 % | |
3 | 0 % | |
2 | 0 % | |
1 | 0 % |
Avis clients
February 12, 2026
The part that matters is bad ideas get easier to avoid, and 20 signals is a fair first sample.
February 9, 2026
Two sessions say more than one clean chart, and weak ideas are easier to skip.
February 5, 2026
Ngl, weak ideas are easier to skip and that is enough to keep testing it. Price action still has to agree.
Discussion
Questions fréquentes
Signal
Indices
Commodities
GBPUSD
RSI
Bollinger
Fibonacci
Scalping
AI
XAUUSD
NAS100
MACD
BTCUSD
Forex
Breakout
EURUSD
NZDUSD
Martingale
Prop
ZigZag
Supertrend
Fair Value Gap
SMC
Crypto
Grid
Stocks
ATR
USDJPY
VWAP
Les produits disponibles sur cTrader Store, notamment les bots de trading, les indicateurs et les plug-ins, sont fournis par des développeurs tiers et mis à disposition à titre informatif et à des fins d'accès technique uniquement. cTrader Store n'est pas un courtier et ne fournit aucun conseil en investissement, aucune recommandation personnelle ni aucune garantie quant aux performances futures.


Prix
41.97M
Volume tradé
208.53K
Pips gagnés
13
Ventes
354
Installations gratuites