
Description
TREND ANALYSIS est un indicateur technique avancé pour la plateforme cTrader qui combine plusieurs approches analytiques en une seule solution. Développé pour les traders recherchant une confirmation de tendance par convergence d'indicateurs, il offre une vue complète du marché avec des signaux précis et des filtres de validation.
REGARDEZ LA VIDÉO D'INTRODUCTION SUR LA STRATÉGIE OPÉRATIONNELLE !
🎯 STRATÉGIES D'UTILISATION
1. Trading de suivi de tendance
Application : Identifier et suivre les tendances établies
Période : H4, D1 pour des positions plus longues
Paramètres : ADX > 25, Volume au-dessus de la moyenne
Gestion des risques : Stop-loss sous la moyenne mobile à 50 périodes
2. Swing Trading
Application : Capturer les mouvements à moyen terme
Période : H1, H4
Paramètres : Filtre de volume activé, confirmation par Volume Profile
Objectifs : Volume Profile POC comme TP
3. Trading de cassure
Application : Entrer lors des cassures de support/résistance
Paramètres : Volume PVA pour confirmer la force du mouvement
Confirmation : ADX en hausse + Volume au-dessus de la moyenne
4. Scalping (périodes plus courtes)
Application : Trades rapides avec multiples confirmations
Période : M1, M5
Paramètres : Filtres de volume stricts et Momentum
🔧 COMMENT FONCTIONNENT LES INDICATEURS
NUCLEUS ADX & DI
ADX (Average Directional Index)
Fonction : Mesurer la force de la tendance
Interprétation :
0-25 : Tendance faible/mouvement latéral
25-50 : Tendance forte
50+ : Tendance très forte
Utilisation pratique : Éviter les trades lorsque ADX < 20
+DI / -DI (Indicateurs directionnels)
+DI : Force des acheteurs
-DI : Force des vendeurs
Signal : Croisement de +DI au-dessus de -DI (achat) et inversement
Pente ADX (ADX Slope)
Fonction : Mesurer l'accélération de la tendance
Affichage : Histogramme cyan
Signal : Les valeurs positives indiquent un renforcement de la tendance
FILTRES DE VOLUME
Filtre MA Volume
Fonction : Valider les signaux avec un volume supérieur à la moyenne
Paramètres : Période 20, Multiplicateur 1.0
Utilisation : Confirmation de l'intérêt institutionnel
Volume PVA (Price Volume Analysis)
Couleurs et Signification :
Vert : Achat avec un volume très élevé (>150% de la moyenne)
Bleu : Achat avec un volume élevé
Rouge : Vente avec un volume très élevé
Rose : Vente avec un volume élevé
Jaune : Pin Bar/épuisement avec cassure de support
VOLUME PROFILE
POC (Point of Control)
Fonction : Prix avec le volume échangé le plus élevé
Utilisation : Cible naturelle pour les trades, support/résistance dynamique
Zone de valeur
Fonction : Zone où 70% du volume a été échangé
Interprétation :
Prix au-dessus : Tendance haussière
Prix en dessous : Tendance baissière
À l'intérieur : Mouvement latéral possible
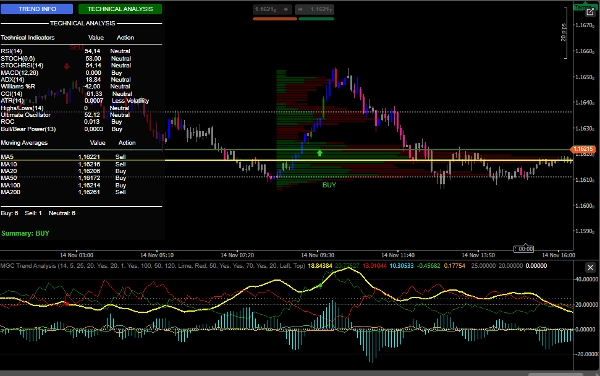
ANALYSE TECHNIQUE COMPLÈTE
Panneau d'indicateurs
RSI : Survendu (<30) / Suracheté (>70)
MACD : Momentum
Williams %R : Conditions extrêmes
CCI : Identification des retournements
Stochastique : Momentum à court terme
Ultimate Oscillator : Momentum multi-périodes
Moyennes mobiles
Ensemble complet de MM (5, 10, 20, 50, 100, 200)
Analyse d'alignement pour la tendance
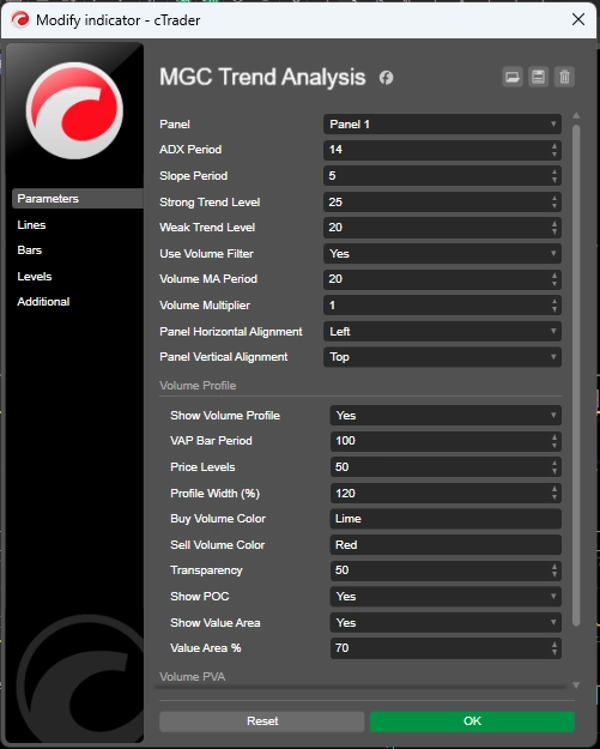
⚙️ PARAMÈTRES RECOMMANDÉS
Paramètre conservateur
javascript
Période ADX : 14
Période de pente : 5
Niveau de tendance forte : 25
Niveau de tendance faible : 20
Utiliser le filtre de volume : true
Période MA Volume : 20
Multiplicateur de volume : 1.2
Paramètre agressif
javascript
Période ADX : 10
Période de pente : 3
Niveau de tendance forte : 20
Niveau de tendance faible : 15
Utiliser le filtre de volume : true
Période MA Volume : 14
Multiplicateur de volume : 1.0
Volume Profile (Recommandé)
javascript
Afficher Volume Profile : true
Période barre VAP : 100
Niveaux de prix : 50
% Zone de valeur : 70
Afficher POC : true
🎨 RESSOURCES VISUELLES
Interface utilisateur
Panneau dynamique : Informations en temps réel
Boutons interactifs : Permettent de basculer entre les analyses
Couleurs intuitives : Codage basé sur la fonction
Signaux graphiques
Flèches : Entrées ACHAT/VENTE
Sons : Alertes sonores
Couleurs des barres : Analyse PVA intégrée
Résumé
Avis clients
5 | 67 % | |
4 | 33 % | |
3 | 0 % | |
2 | 0 % | |
1 | 0 % |


