
الوصف
أكمل استراتيجياتك مع مؤشر الإشارة هذا👇🏻
https://ctrader.com/pt/products/1560?u=Goulart
✔ميزات المؤشر
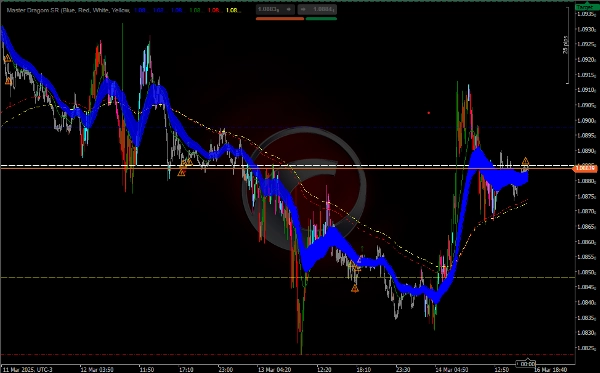
الدعم والمقاومة (SR):
يرسم المؤشر خطوطًا أفقية لمستويات الدعم والمقاومة اليومية والأسبوعية والشهرية.
يمكنك تمكين أو تعطيل كل مستوى (الافتتاح، الإغلاق، الأعلى، والأدنى) حسب الحاجة.
المتوسطات المتحركة الأسية (EMA):
يحسب المؤشر عدة متوسطات متحركة أسية (50، 25، 200، و233 فترة) للمساعدة في تحديد الاتجاهات ومناطق الدعم/المقاومة الديناميكية المحتملة.
يتم رسم المتوسطات المتحركة الأسية على الرسم البياني بألوان مختلفة لسهولة المشاهدة.
تحليل الحجم (PVAVolumeAnalysis):
يحلل المؤشر الحجم لتحديد احتمالات انعكاس الاتجاه أو استمراره.
يسلط الضوء على الأعمدة ذات الحجم الأعلى من المتوسط ويشير إلى تغييرات كبيرة في الحجم باستخدام رموز (↑، ↓، ⚠️).
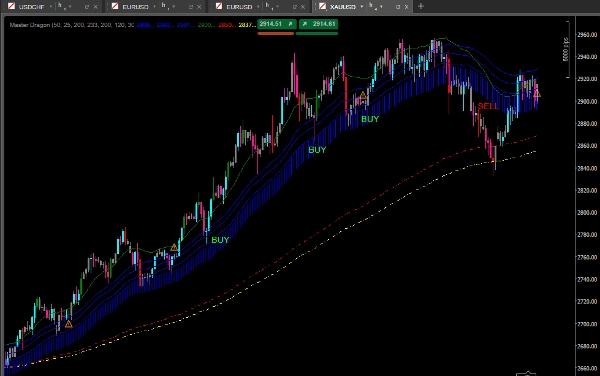
تلوين الأعمدة:
يتم تلوين الأعمدة بناءً على الحجم واتجاه السعر (صعود أو هبوط)، مما يساعد في تحديد قوة الاتجاه.
تحليل الاتجاه باستخدام المتوسطات المتحركة الأسية:
استخدم المتوسطات المتحركة الأسية لتحديد اتجاه الاتجاه:
إذا كان السعر فوق المتوسطات المتحركة الأسية (خاصة 200 و233)، فإن الاتجاه صاعد.
إذا كان السعر تحت المتوسطات المتحركة الأسية، فإن الاتجاه هابط.
يمكن استخدام المنطقة بين أعلى وأدنى متوسط متحرك أسي 50 كمنطقة اهتمام للانعكاسات أو الاستمراريات المحتملة.
تحليل الحجم:
راقب الرموز وألوان الأعمدة لتحديد التغيرات في الحجم:
حجم مرتفع مع ارتفاع السعر (↑): تأكيد على اتجاه صاعد.
حجم مرتفع مع انخفاض السعر (↓): تأكيد على اتجاه هابط.
حجم منخفض مع ارتفاع أو انخفاض السعر (⚠️): احتمال انعكاس.
دمج الإشارات:
ادمج إشارات الحجم، المتوسطات المتحركة الأسية، ومستويات الدعم والمقاومة لاتخاذ قرارات الدخول أو الخروج.
على سبيل المثال، إذا كان السعر قريبًا من مستوى مقاومة والحجم يتناقص، فقد يكون ذلك إشارة انعكاس.
الاستراتيجية المقترحة
استراتيجية الاتجاه مع تأكيد الحجم
تحديد الاتجاه:
استخدم المتوسطات المتحركة الأسية (200 و233) لتحديد الاتجاه الرئيسي.
إذا كان السعر فوق المتوسطات المتحركة الأسية، اعتبر عمليات الشراء فقط.
إذا كان السعر تحت المتوسطات المتحركة الأسية، اعتبر عمليات البيع فقط.
انتظر ارتداد السعر:
انتظر عودة السعر إلى متوسط متحرك أسي بفترة أقصر (50 أو 25) أو إلى مستوى دعم/مقاومة.
التأكيد بالحجم:
تحقق مما إذا كان الحجم يزداد في اتجاه الاتجاه (↑ للشراء، ↓ للبيع).
المتوسطات المتحركة تحدد الاتجاهات، الارتدادات، إشارات الحجم، الانعكاسات، الدعم والمقاومة.
إذا كان الحجم يتناقص (⚠️)، تجنب الدخول أو اعتبر احتمال انعكاس.
الدخول:
اشترِ عندما يكون السعر فوق المتوسطات المتحركة الأسية وقريبًا من مستوى دعم، مع تأكيد الحجم على الاتجاه الصاعد.
بع عندما يكون السعر تحت المتوسطات المتحركة الأسية وقريبًا من مستوى مقاومة، مع تأكيد الحجم على الاتجاه الهابط.
الخروج:
استخدم مستويات الدعم والمقاومة أو المتوسطات المتحركة الأسية كنقاط هدف أو خروج.
على سبيل المثال، أغلق أو بع عندما يصل إلى مستوى دعم.
الملخص
Volume analysis is integrated to detect potential trend reversals or continuations by highlighting bars with above-average volume and signaling significant volume changes using icons (↑ for rising volume confirming uptrends, ↓ for falling volume confirming downtrends, and ⚠️ for low volume indicating possible reversals). Bars are color-coded based on volume and price direction to visually represent trend strength.
Traders can combine signals from volume, EMAs, and support/resistance levels to make informed entry and exit decisions. A suggested strategy involves identifying the main trend using the 200 and 233 EMAs, waiting for pullbacks to shorter EMAs or support/resistance levels, and confirming with volume signals before entering trades. Exit points can be set at support/resistance levels or EMA lines. This indicator is suitable for enhancing trend, pullback, volume, reversal, and support/resistance analysis in various trading strategies.
تقييمات العملاء
5 | 100 % | |
4 | 0 % | |
3 | 0 % | |
2 | 0 % | |
1 | 0 % |


