الوصف
نقاط SC RSI
مؤشر RSI بسيط يستخدم نقاطًا ديناميكية لتصور الزخم بشكل أنظف وأسرع.
نقاط SC RSI هي تفسير بسيط لمؤشر RSI الكلاسيكي (مؤشر القوة النسبية)، مصمم لتوفير عرض أنظف وأكثر بديهية لزخم السوق دون ازدحام الرسم البياني بخطوط غير ضرورية.
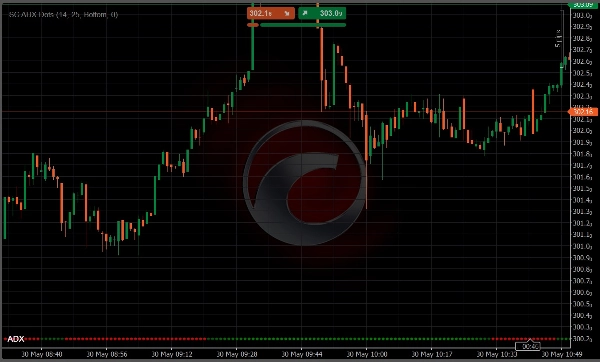
بدلاً من عرض خط RSI التقليدي، يستخدم المؤشر نقاطًا ديناميكية لتمثيل قيم RSI مع مرور الوقت.
يخلق هذا النهج تخطيطًا أنظف وأكثر حداثة للرسم البياني يسهل قراءته، خاصة للمتداولين الذين يستخدمون أدوات متعددة في نفس الوقت.
الميزات الرئيسية
- عرض RSI باستخدام نقاط بدلاً من الخطوط
- مظهر رسم بياني أنظف وأقل تشتيتًا
- تصور لوني ديناميكي بناءً على موقع RSI
- لون مخصص لحالات التشبع البيعي
- لون مخصص لحالات التشبع الشرائي
- تدرج في شدة اللون مع اقتراب RSI من المستويات القصوى
- تحديد بصري فوري لتحولات الزخم
- التعرف السريع على قوة السوق وضعفه
- مثالي للتداول السريع، التداول اليومي، والتداول التقديري
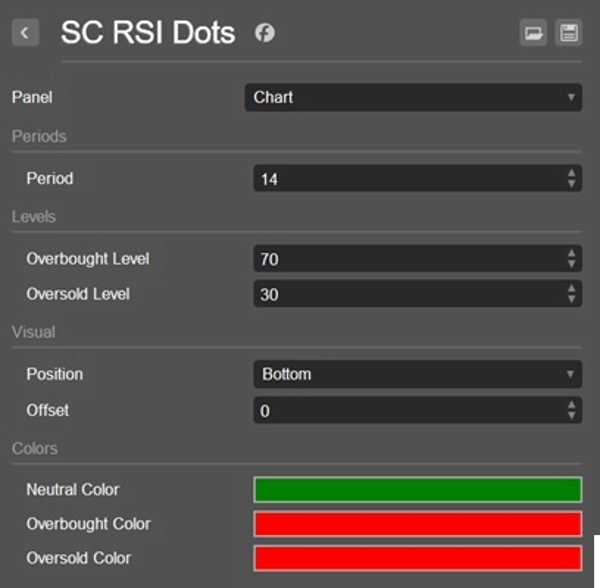
كيف يعمل نظام الألوان
تستخدم نقاط SC RSI محرك ألوان ديناميكي لتبسيط تفسير RSI.
- لون مخصص يحدد حالات التشبع البيعي.
- لون مخصص يحدد حالات التشبع الشرائي.
- بين هاتين المنطقتين، تزداد شدة اللون تدريجيًا مع اقتراب RSI من أي من الطرفين.
يسمح هذا النهج البصري للمتداولين بفهم مكان تطور الزخم على الفور دون الحاجة لمراقبة خط المؤشر التقليدي باستمرار.
والنتيجة هي قراءة أسرع وأكثر بديهية لحالات RSI مباشرة من الرسم البياني.
لماذا تستخدم نقاط SC RSI
غالبًا ما تتطلب مؤشرات RSI التقليدية من المتداولين مراقبة خط المؤشر وتفاعله مع مستويات التشبع الشرائي والبيعي باستمرار.
تم إنشاء نقاط SC RSI بهدف واحد:
الحفاظ على نظافة الرسم البياني بصريًا مع توفير كل المعلومات الأساسية عن الزخم وظروف السوق.
يجعل تصور النقاط التكيفي من السهل التعرف على:
- زيادة الزخم الصعودي
- زيادة الزخم الهبوطي
- اقتراب حالات التشبع الشرائي
- اقتراب حالات التشبع البيعي
- احتمال نفاد الزخم
كل ذلك دون تشتيت الانتباه بخطوط إضافية على الشاشة.
مثالي لـ
- المتداولين الذين يفضلون الرسوم البيانية النظيفة
- متداولي الزخم
- متداولي حركة السعر
- المتداولين السريعين واليومي
- إعدادات التداول متعددة المؤشرات
- تحليل السوق السريع
ملاحظة مهمة
تم تصميم نقاط SC RSI للاستخدام مباشرة على الرسم البياني الرئيسي للسعر.
على عكس مؤشرات RSI التقليدية، يعتمد مفهومه البصري على دمج معلومات الزخم في تحليل حركة السعر. ولهذا السبب، لا يُنصح باستخدام المؤشر في لوحة منفصلة ولا يوفر تجربة المستخدم المقصودة.
بسيط. نظيف. بديهي.
الملخص
Key features include:
- RSI values represented by dots with dynamic colors reflecting momentum strength.
- Distinct colors for oversold and overbought conditions.
- Progressive color intensity indicating proximity to extreme RSI levels.
- Instant visual cues for momentum shifts, market strength, and weakness.
The indicator is suitable for scalping, intraday, momentum, and price action traders who prefer clean charts and use multiple tools simultaneously. It supports visualization of reversal signals, trend strength, and level touches or breaks based on RSI behavior. SC RSI Dots is intended for use on the main price chart rather than a separate panel, enhancing direct correlation between momentum and price movements.
تقييمات العملاء
5 | 100 % | |
4 | 0 % | |
3 | 0 % | |
2 | 0 % | |
1 | 0 % |