Description
Structure du marché SC
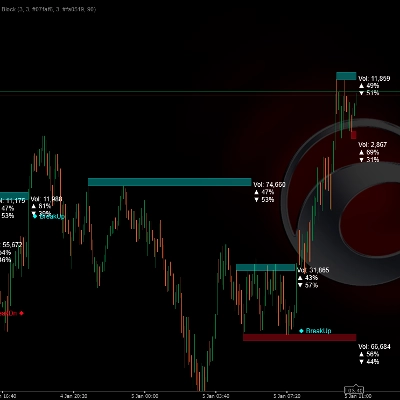
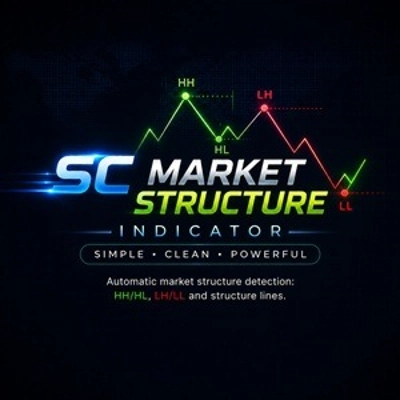
Structure du marché SC est un indicateur visuel de structure de marché conçu pour identifier et afficher automatiquement les plus hauts et les plus bas importants directement sur le graphique.
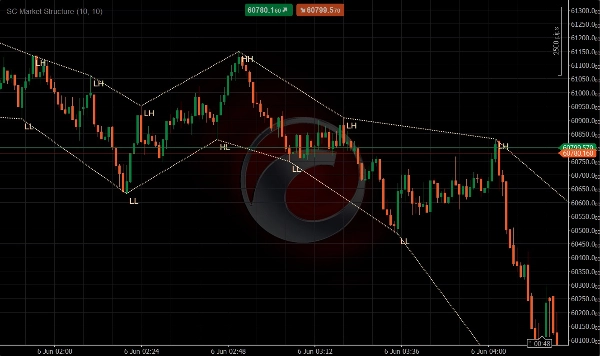
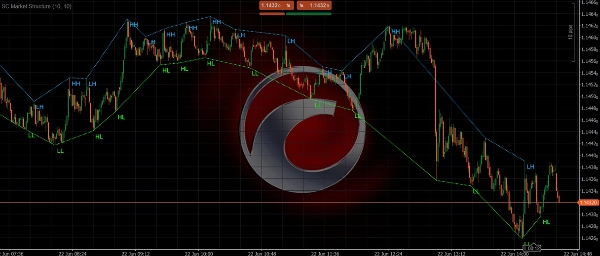
L'indicateur analyse en continu l'action des prix et cartographie l'évolution de la structure du marché en reliant les hauts et bas significatifs avec des lignes de structure dynamiques. Cela permet aux traders de reconnaître instantanément la direction de la tendance, la continuation de la tendance et les points potentiels de retournement sans marquer manuellement les oscillations du marché.
De plus, SC Market Structure classe automatiquement chaque nouveau point structurel en utilisant les définitions standard de la structure du marché :
- HH (Higher High)
- HL (Higher Low)
- LH (Lower High)
- LL (Lower Low)
En combinant la détection automatique des oscillations avec l'étiquetage en temps réel de la structure du marché, les traders peuvent rapidement comprendre si le marché est en tendance, en consolidation ou montre des signes d'un retournement potentiel de tendance.
Caractéristiques clés
• Détection automatique des hauts et bas significatifs
• Lignes de structure dynamiques reliant les pivots du marché
• Identification automatique des Higher Highs (HH)
• Identification automatique des Higher Lows (HL)
• Identification automatique des Lower Highs (LH)
• Identification automatique des Lower Lows (LL)
• Visualisation claire de la structure de marché haussière et baissière
• Reconnaissance immédiate des patterns de continuation et de retournement de tendance
• Fonctionne sur tous les marchés et toutes les unités de temps
• Présentation propre et intuitive du graphique
Visualisation de la structure du marché
SC Market Structure évalue continuellement les oscillations des prix et étiquette chaque point structurel nouvellement confirmé.
Structure haussière
Une structure de marché haussière est identifiée lorsque le prix forme :
• Higher Highs (HH)
• Higher Lows (HL)
Cette séquence indique que les acheteurs restent aux commandes et que la tendance haussière est toujours intacte.
Structure baissière
Une structure de marché baissière est identifiée lorsque le prix forme :
• Lower Highs (LH)
• Lower Lows (LL)
Cette séquence indique que les vendeurs restent aux commandes et que la tendance baissière est toujours intacte.
L'indicateur relie visuellement ces points structurels à l'aide de lignes de tendance dynamiques, permettant aux traders de suivre l'évolution de la structure des prix en temps réel.
Pourquoi utiliser SC Market Structure
Comprendre la structure du marché est l'un des aspects les plus importants du trading basé sur l'action des prix.
De nombreux traders dessinent manuellement les hauts, les bas et la structure de la tendance, ce qui peut être chronophage et subjectif.
SC Market Structure automatise ce processus en identifiant objectivement les pivots structurels et en les étiquetant selon les principes professionnels de la structure du marché.
Cela permet aux traders de :
• Lire la direction de la tendance plus rapidement
• Identifier les retournements potentiels plus tôt
• Confirmer les configurations de continuation de tendance
• Améliorer le timing des entrées et sorties
• Maintenir un graphique plus propre et mieux organisé
Parfait pour
• Traders Price Action
• Scalpers
• Day traders
• Swing traders
• Traders suivant la tendance
• Traders en structure de marché
• Traders Smart Money Concept (SMC)
• Traders recherchant une analyse objective de la structure
Note importante
SC Market Structure identifie la structure du marché sur la base des hauts et bas confirmés. Les étiquettes et les lignes de structure sont générées uniquement après qu'un pivot a été validé par les paramètres de calcul sélectionnés.
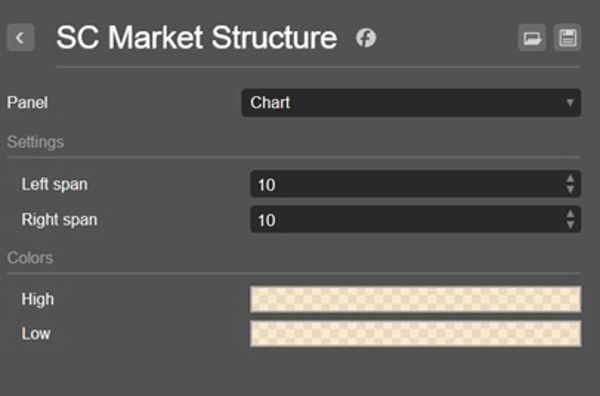
L'ajustement des paramètres de sensibilité affectera la fréquence à laquelle de nouveaux points de structure sont identifiés et affichés.
Contrairement aux indicateurs MACD traditionnels, son concept visuel est construit autour de l'intégration des informations de momentum dans l'analyse de l'action des prix. Pour cette raison, l'utilisation de l'indicateur dans un panneau séparé n'est pas recommandée et ne fournit pas l'expérience utilisateur prévue.
Lisez la tendance. Suivez la structure. Tradez en toute confiance.
Résumé
By continuously analyzing price action, SC Market Structure helps traders quickly determine trend direction, recognize trend continuation, and spot potential reversal points without manual chart annotations. It supports all markets and timeframes, providing a clean and intuitive chart presentation.
This tool is suited for price action traders, scalpers, day traders, swing traders, trend followers, and those using Smart Money Concepts or seeking objective market structure analysis. Sensitivity settings allow customization of pivot detection frequency. The indicator integrates momentum information into price action analysis and is designed for direct chart overlay rather than separate panels.
Discussion
Avis clients
5 | 100 % | |
4 | 0 % | |
3 | 0 % | |
2 | 0 % | |
1 | 0 % |