Description
SC MACD Dots
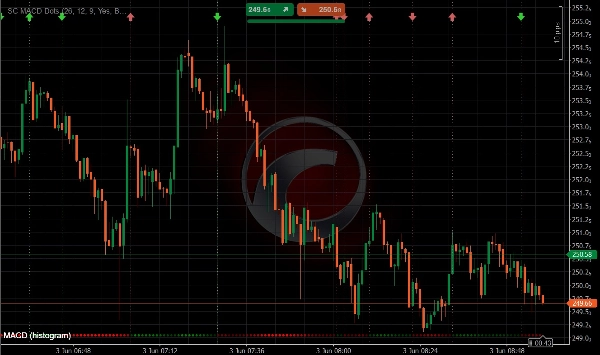
SC MACD Dots is a minimalist version of the classic MACD indicator, designed to provide a cleaner and more intuitive view of momentum without cluttering the chart with traditional histogram bars and multiple lines.
Instead of displaying the standard MACD histogram, the indicator uses dynamic dots to represent histogram values over time. This approach creates a modern and visually efficient layout that allows traders to instantly identify momentum changes, trend acceleration, and potential reversals.
The dots adapt both color and intensity according to histogram strength, making it easy to recognize increasing or decreasing momentum at a glance.
In addition, SC MACD Dots automatically highlights MACD signal-line crossings, allowing traders to quickly identify potential trend changes and momentum shifts.
Key Features
• Histogram displayed using dynamic dots instead of traditional bars
• Cleaner and less distracting chart appearance
• Dot color and intensity change dynamically according to histogram strength
• Instant visual identification of increasing and decreasing momentum
• Automatic detection of MACD crossing events
• Different colors for upward and downward crossings
• Positive-zone and negative-zone crossings use different visual styles
• Faster visual interpretation of momentum shifts and trend reversals
• Ideal for scalping, intraday trading, swing trading, and discretionary trading
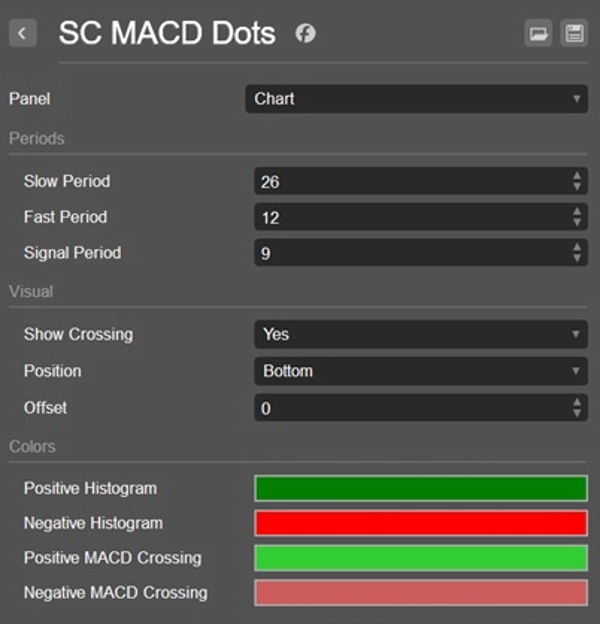
Crossing Visualization
SC MACD Dots highlights every MACD crossing event:
• Upward crossings (bullish) are displayed using dedicated bullish colors
• Downward crossings (bearish) are displayed using dedicated bearish colors
• Crossings occurring above the zero line (positive MACD territory) use a different color scheme from those occurring below the zero line (negative MACD territory)
• This allows traders to instantly distinguish between stronger and weaker momentum signals
Why Use SC MACD Dots
Traditional MACD indicators often require traders to monitor multiple lines and histogram bars simultaneously, which can make charts appear crowded and difficult to read.
SC MACD Dots was created with one goal in mind:
to simplify MACD analysis while preserving all essential momentum information.
The adaptive dot visualization allows traders to quickly evaluate histogram strength, momentum acceleration, momentum deceleration, and crossing signals without the distraction of unnecessary visual elements.
By combining dynamic histogram dots with intelligent crossing visualization, traders can identify opportunities faster and maintain a cleaner trading workspace.
Perfect For
• Traders who prefer clean charts
• Momentum traders
• Scalpers and day traders
• Swing traders
• Multi-indicator trading setups
• Fast market analysis
• Traders who rely on MACD crossing signals
Important Note
SC MACD Dots is designed to be used directly on the main price chart.
Unlike traditional MACD indicators, its visual concept is built around integrating momentum information into price action analysis. For this reason, using the indicator in a separate panel is not recommended and does not provide the intended user experience.
Simple. Clean. Powerful.
Summary
Customer reviews
5 | 100 % | |
4 | 0 % | |
3 | 0 % | |
2 | 0 % | |
1 | 0 % |