Description
SC Supports & Resistances
The Professional Support & Resistance Tool Every Trader Should Have
SC Supports & Resistances is an advanced price action indicator designed to automatically identify, manage, and visualize dynamic support and resistance zones directly on the chart.
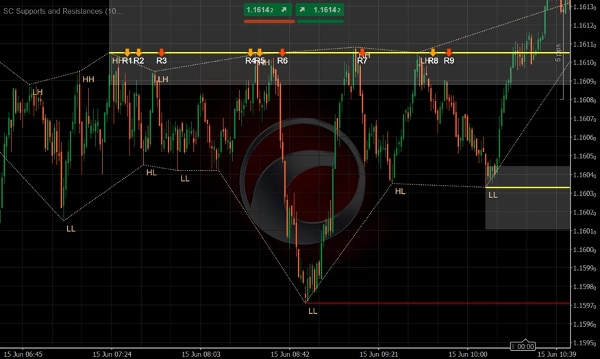
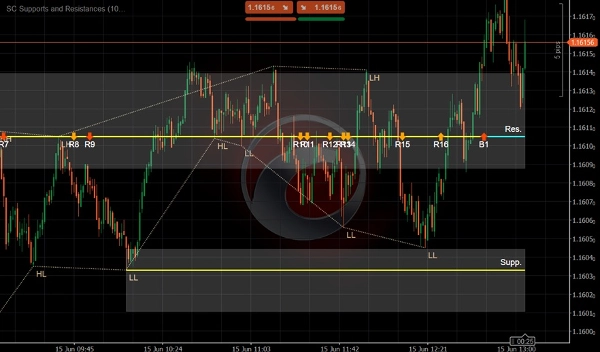
Unlike traditional support and resistance tools that rely on simple horizontal lines, SC Supports & Resistances uses adaptive ATR-based bands to represent realistic market reaction areas, helping traders understand where price is most likely to reject, consolidate, or break through.
The indicator continuously analyzes market swings to detect significant support and resistance levels, tracks how price interacts with each zone over time, and automatically classifies every reaction as a Rejection or Breakout. Strong reactions are highlighted separately, allowing traders to immediately distinguish between minor tests and meaningful market events.
By combining intelligent level detection, dynamic zone management, and real-time reaction analysis, SC Supports & Resistances transforms support and resistance trading into an objective and measurable process.
Key Features
✔ Automatic detection of significant support and resistance zones
✔ Dynamic ATR-based bands that adapt to market volatility
✔ Automatic identification of Rejections and Breakouts
✔ Detection of Strong Rejections and Strong Breakouts
✔ Real-time tracking of level strength and market reactions
✔ Intelligent swing-level recognition based on price behavior
✔ Automatic expiration of obsolete levels to keep charts clean
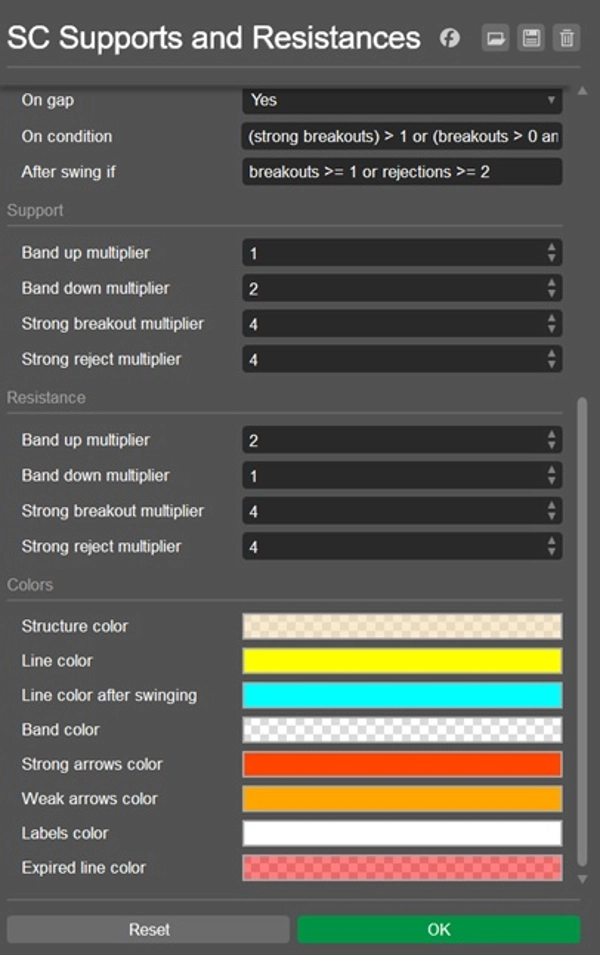
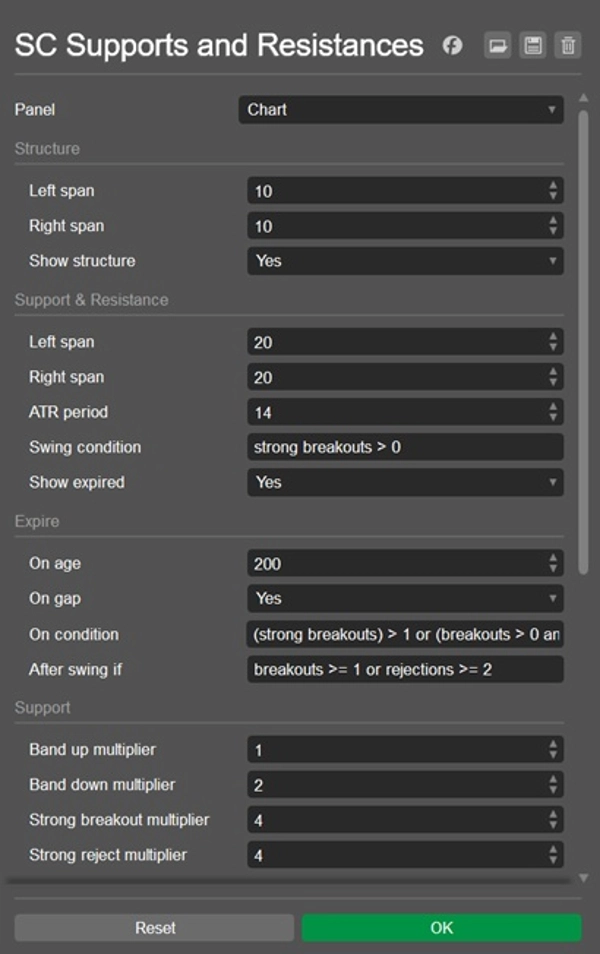
✔ Fully customizable sensitivity and reaction criteria
✔ Clear visual representation with bands, arrows, labels, and statistics
✔ Works on all markets and all timeframes
Advanced Level Intelligence
SC Supports & Resistances does much more than simply draw levels.
Every detected zone evolves according to how the market interacts with it. The indicator continuously monitors:
- Rejections
- Breakouts
- Strong Rejections
- Strong Breakouts
- Level Age
- Swing Formation
As market conditions change, levels can automatically gain importance, become significant swing levels, or expire when they are no longer relevant.
This creates a living support and resistance framework that reflects actual market behavior rather than static historical lines.
Dynamic Bands Instead of Single Lines
Markets rarely react to an exact price.
For this reason, SC Supports & Resistances represents every level as a dynamic price zone, whose size automatically adapts to volatility through ATR calculations.
This provides a more realistic representation of supply and demand areas while reducing false signals generated by insignificant price penetrations.
The result is a cleaner and more accurate view of where market participants are truly defending price.
Reaction-Based Trading Signals
Every interaction with a support or resistance zone is evaluated in real time.
When price rejects a zone, the indicator generates clear directional signals. When price successfully breaks through a level, breakout signals are generated and classified according to their strength.
This allows traders to instantly identify:
- Potential reversal opportunities
- Trend continuation setups
- Breakout confirmations
- Failed breakout attempts
- High-interest institutional reaction zones
Automatic Level Lifecycle Management
One of the biggest challenges in support and resistance trading is determining when a level is no longer relevant.
SC Supports & Resistances automatically manages the entire lifecycle of every level through intelligent expiration logic based on:
- Market inactivity
- Price gaps
- Breakout behavior
- Rejection behavior
- Swing confirmation logic
The result is a chart that remains focused only on levels that still matter, eliminating unnecessary clutter and outdated information.
Why Use SC Supports & Resistances
Support and resistance remain among the most important concepts in technical analysis, yet many traders still draw levels manually, leading to subjective interpretations and inconsistent results.
SC Supports & Resistances removes this uncertainty by providing an objective, rules-based approach to identifying and managing key market levels.
This allows traders to:
✔ Identify high-probability reaction zones faster
✔ Measure the strength of support and resistance levels
✔ Detect meaningful breakouts and rejections instantly
✔ Improve entry and exit timing
✔ Reduce chart clutter
✔ Trade with greater confidence and consistency
Perfect For
- Price Action Traders
- Scalpers
- Day Traders
- Swing Traders
- Trend Traders
- Smart Money Concept (SMC) Traders
- Support & Resistance Traders
- Professional Technical Analysts
Important Note
SC Supports & Resistances identifies levels using confirmed market pivots and adaptive volatility calculations.
The quality and frequency of generated levels depend on the selected sensitivity settings and reaction parameters.
Adjusting these settings allows traders to tailor the indicator to different markets, trading styles, and timeframes.
Identify the Levels. Measure the Reactions.
Trade What Matters.
Summary
Key functionalities include automatic detection and expiration of levels, intelligent swing-level recognition, and customizable sensitivity settings. Visual outputs feature dynamic bands, arrows, labels, and statistics to clearly represent zones and market reactions. This tool supports all markets and timeframes, providing objective, rules-based identification of key price levels to assist traders in recognizing potential reversals, trend continuations, breakout confirmations, and institutional reaction zones.
SC Supports & Resistances is suitable for various trading styles, including price action, scalping, day trading, swing trading, trend trading, and Smart Money Concept approaches. It aims to reduce chart clutter and improve entry and exit timing by maintaining a living framework of relevant support and resistance levels that evolve with market behavior.