Description
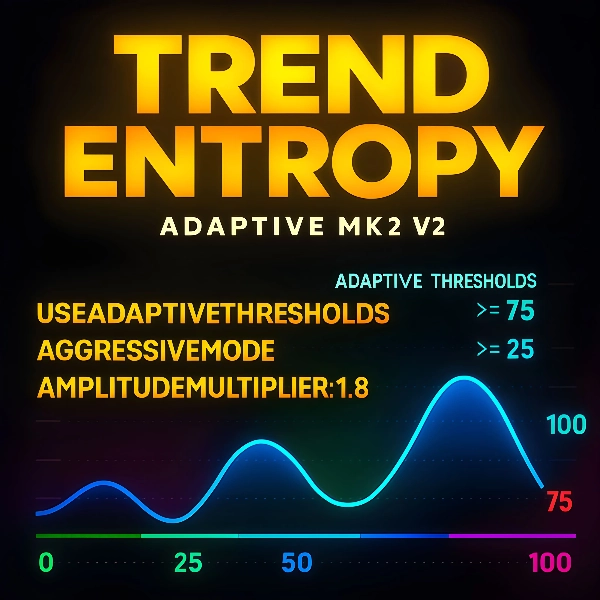
Trend Entropy – Free cTrader Indicator
Entropy is the scientific measure of disorder or uncertainty in a system. In physics, it shows how energy disperses and why systems move toward chaos. In information theory, it measures unpredictability in data. Low entropy means order and predictability, while high entropy reflects randomness, complexity, and reduced clarity of outcomes.
Discover the power of order within chaos. Trend Entropy is a cutting‑edge technical indicator designed to measure the organization versus randomness of price movements. Unlike traditional oscillators that only track momentum or volatility, Trend Entropy applies advanced entropy calculations to reveal whether the market is trending in a structured way or drifting into chaotic ranging behavior.
This free tool is built for traders who want deeper insight into the hidden dynamics of price action. By blending statistical entropy with RSI‑style smoothing and adaptive thresholds, Trend Entropy transforms raw volatility into a clear, normalized scale from 0% to 100%. The result is a single, elegant line that tells you whether the market is in a strong trend, a neutral consolidation, or a volatile range.
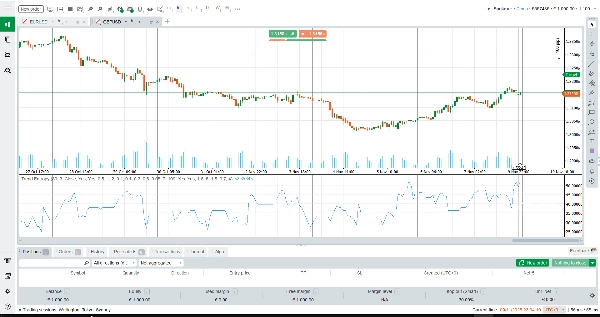
How to Read Trend Entropy
Low values (0–33%): The market is organized. If the average return is positive, it suggests a likely uptrend. If negative, it signals a likely downtrend.
Mid values (34–66%): Neutral territory. The market may be consolidating, with a slight lean toward bullish or bearish depending on the mean return.
High values (67–100%): Chaos dominates. Price action is ranging, unpredictable, and less reliable for trend‑following strategies.
Horizontal reference lines at 25%, 50%, and 75% make interpretation simple. Traders can instantly see whether entropy is compressing toward order or expanding toward chaos.
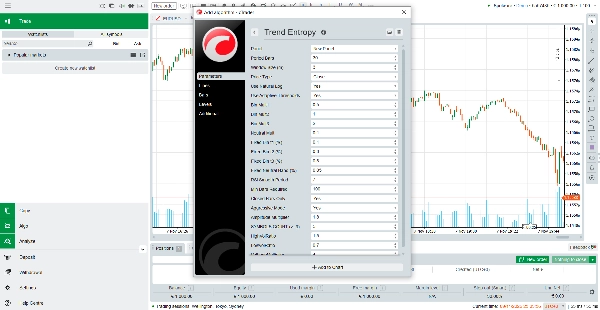
How the Indicator Works
Trend Entropy calculates returns over a chosen period and maps them into symbolic states. These states are analyzed in overlapping windows to build a frequency distribution of price patterns. Using entropy mathematics, the indicator measures the degree of disorder in these sequences.
To make the output practical, the raw entropy is normalized to a percentage scale and then smoothed using a Wilder‑style averaging method. Adaptive thresholds ensure the indicator adjusts to current volatility, while aggressive mode amplifies signals for traders who prefer sharper responses. Finally, volatility ratios are applied to refine the reading, pushing values higher in chaotic conditions and lower in stable ones.
The end result is a single smoothed line that captures the essence of market structure: whether price is trending with order or drifting into randomness.
Key Features
Entropy‑based analysis – Goes beyond momentum to measure the true organization of price action.
Adaptive thresholds – Automatically adjusts to volatility, keeping signals relevant in all market conditions.
RSI‑style smoothing – Provides a clean, stable line that avoids noisy fluctuations.
Volatility integration – Enhances accuracy by comparing short‑term and long‑term volatility ratios.
Clear visual design – Horizontal reference levels and a single DodgerBlue line make interpretation effortless.
Why Choose Trend Entropy?
Trend Entropy is not just another oscillator. It’s a hybrid tool that combines statistical rigor with trader‑friendly visualization. Whether you are a trend‑follower looking for confirmation, or a range trader seeking to avoid chaotic markets, this indicator gives you the clarity you need.
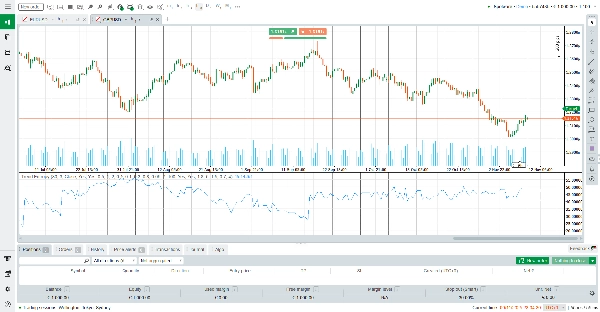
Summary
The indicator outputs a single smoothed line on a normalized scale from 0% to 100%, where low values (0–33%) indicate organized trending markets, mid values (34–66%) suggest neutral or consolidating conditions, and high values (67–100%) reflect chaotic, ranging markets. Horizontal reference lines at 25%, 50%, and 75% aid interpretation.
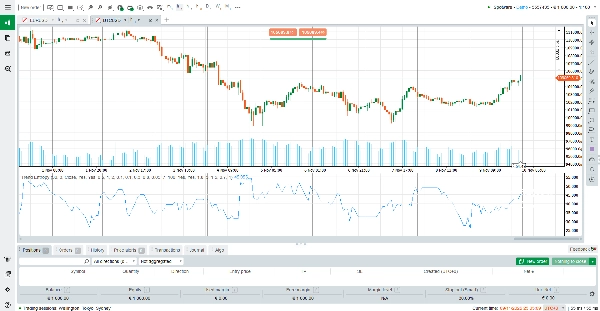
Trend Entropy pro incorporates RSI-style smoothing, adaptive thresholds that adjust to current volatility, and volatility ratio integration to enhance signal accuracy. It is designed to provide traders with deeper insight into market dynamics beyond traditional momentum or volatility indicators, supporting analysis across various markets including Forex, cryptocurrencies, commodities, indices, and stocks.
This indicator is suitable for traders seeking to identify trending versus ranging conditions and improve decision-making in trend-following or range-trading strategies.