
الوصف
نقاط SC MACD
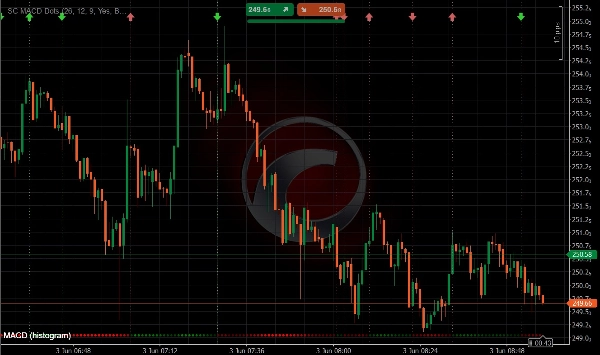
نقاط SC MACD هي نسخة مبسطة من مؤشر MACD الكلاسيكي، مصممة لتوفير عرض أنظف وأكثر بديهية للزخم دون ازدحام الرسم البياني بأشرطة المدرج التكراري التقليدية والخطوط المتعددة.
بدلاً من عرض المدرج التكراري القياسي لـ MACD، يستخدم المؤشر نقاطًا ديناميكية لتمثيل قيم المدرج التكراري مع مرور الوقت. يخلق هذا النهج تخطيطًا حديثًا وفعالًا بصريًا يسمح للمتداولين بالتعرف فورًا على تغييرات الزخم، وتسارع الاتجاه، والانعكاسات المحتملة.
تتكيف النقاط مع اللون والشدة وفقًا لقوة المدرج التكراري، مما يجعل من السهل التعرف على زيادة أو نقصان الزخم بنظرة سريعة.
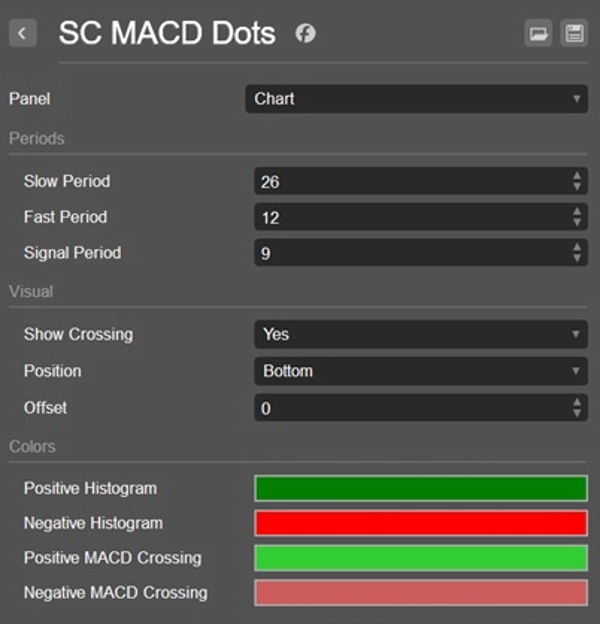
بالإضافة إلى ذلك، تبرز نقاط SC MACD تلقائيًا تقاطعات خط إشارة MACD، مما يسمح للمتداولين بالتعرف بسرعة على تغييرات الاتجاه المحتملة وتحولات الزخم.
الميزات الرئيسية
• عرض المدرج التكراري باستخدام نقاط ديناميكية بدلاً من الأشرطة التقليدية
• مظهر رسم بياني أنظف وأقل تشتيتًا
• تغير لون النقطة وشدتها ديناميكيًا وفقًا لقوة المدرج التكراري
• التعرف البصري الفوري على زيادة ونقصان الزخم
• الكشف التلقائي عن أحداث تقاطع MACD
• ألوان مختلفة للتقاطعات الصاعدة والهابطة
• استخدام أنماط بصرية مختلفة لتقاطعات المنطقة الإيجابية والمنطقة السلبية
• تفسير بصري أسرع لتحولات الزخم وانعكاسات الاتجاه
• مثالي للتداول السريع، والتداول اليومي، وتداول التأرجح، والتداول التقديري
تصوير التقاطعات
تُبرز نقاط SC MACD كل حدث تقاطع MACD:
• التقاطعات الصاعدة (صعودية) تُعرض باستخدام ألوان مخصصة للصعود
• التقاطعات الهابطة (هبوطية) تُعرض باستخدام ألوان مخصصة للهبوط
• التقاطعات التي تحدث فوق خط الصفر (منطقة MACD الإيجابية) تستخدم نظام ألوان مختلف عن تلك التي تحدث تحت خط الصفر (منطقة MACD السلبية)
• هذا يسمح للمتداولين بالتمييز فورًا بين إشارات الزخم الأقوى والأضعف
لماذا تستخدم نقاط SC MACD
غالبًا ما تتطلب مؤشرات MACD التقليدية من المتداولين مراقبة خطوط متعددة وأشرطة المدرج التكراري في نفس الوقت، مما قد يجعل الرسوم البيانية مزدحمة وصعبة القراءة.
تم إنشاء نقاط SC MACD بهدف واحد:
تبسيط تحليل MACD مع الحفاظ على جميع معلومات الزخم الأساسية.
تسمح تصور النقاط التكيفية للمتداولين بتقييم قوة المدرج التكراري، وتسارع الزخم، وتباطؤ الزخم، وإشارات التقاطع بسرعة دون تشتيت العناصر البصرية غير الضرورية.
من خلال الجمع بين نقاط المدرج التكراري الديناميكية وتصوير التقاطعات الذكي، يمكن للمتداولين التعرف على الفرص بشكل أسرع والحفاظ على مساحة عمل تداول أنظف.
مثالي لـ
• المتداولين الذين يفضلون الرسوم البيانية النظيفة
• متداولي الزخم
• المتداولين السريعين واليوميين
• متداولي التأرجح
• إعدادات التداول متعددة المؤشرات
• التحليل السريع للسوق
• المتداولين الذين يعتمدون على إشارات تقاطع MACD
ملاحظة مهمة
تم تصميم نقاط SC MACD للاستخدام مباشرة على الرسم البياني للسعر الرئيسي.
على عكس مؤشرات MACD التقليدية، فإن مفهومه البصري مبني حول دمج معلومات الزخم في تحليل حركة السعر. لهذا السبب، لا يُنصح باستخدام المؤشر في لوحة منفصلة ولا يوفر تجربة المستخدم المقصودة.
بسيط. نظيف. قوي.
الملخص
تقييمات العملاء
5 | 100 % | |
4 | 0 % | |
3 | 0 % | |
2 | 0 % | |
1 | 0 % |


