
MTF Candles
مؤشر
323 التنزيلات
الإصدار 1.0، Mar 2025
Windows, Mac
5.0
التقييمات: 1
الوصف
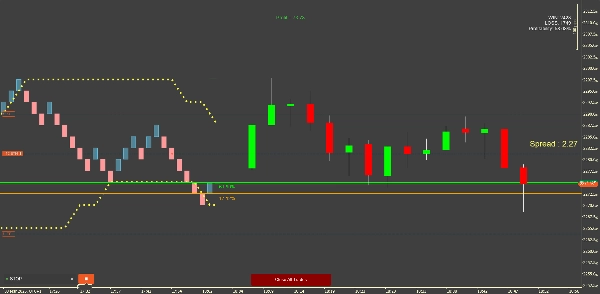
رسم شموع MTF. ارسم أي شموع من أي إطار زمني على مخططك :-) استمتع.
الملخص
ملف تعريف المؤشر
تقييمات العملاء
5.0
التقييمات: 1
5 | 100 % | |
4 | 0 % | |
3 | 0 % | |
2 | 0 % | |
1 | 0 % |
تقييمات العملاء
August 18, 2025
Displays higher timeframe candles on lower charts, customizable, lightweight. Cons: No multiple-TF display, no alerts, limited customization for candle body.
مناقشة
الأسئلة الشائعة
يتم توفير المنتجات المتاحة من خلال cTrader Store، بما في ذلك روبوتات التداول والمؤشرات والإضافات، من قبل مطوري الطرف الثالث وإتاحتها لأغراض الوصول المعلوماتي والفني فقط. cTrader Store ليس وسيطًا ولا يقدم نصائح استثمارية أو توصيات شخصية أو أي ضمان للأداء المستقبلي.


![شعار "[CB] Pivot Points Pro"](https://cdn.ctrader.com/image/webp/43463c82-67b0-4f10-a4ba-901bba091d81_32594)
![شعار "High-Low Divergence [Iridio Capital]"](https://cdn.ctrader.com/image/webp/443c4661-7abb-40f1-842f-4b6ec560649b_40914)


السعر
منذ 09/01/2025
11.78K
التثبيتات المجانية