
Weekly Daily Levels
مؤشر
2 عمليات الشراء
الإصدار 1.0، Aug 2025
Windows, Mac
5.0
التقييمات: 2
الوصف
هل تعتمد على أسعار OHLC اليومية والأسبوعية ونقطة المنتصف في استراتيجية التداول الخاصة بك؟ هل سئمت من تحديدها يدويًا في كل مرة تقوم فيها بالتداول؟
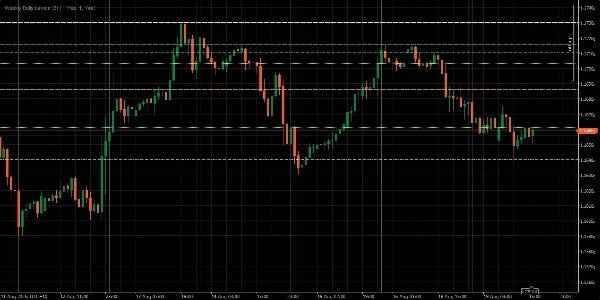
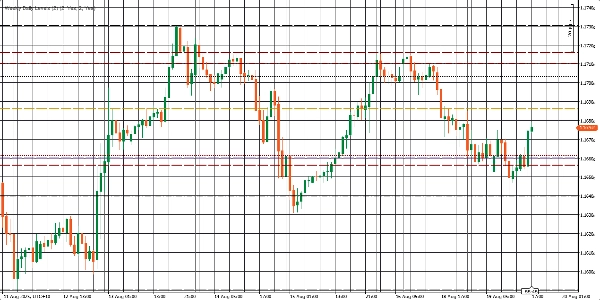
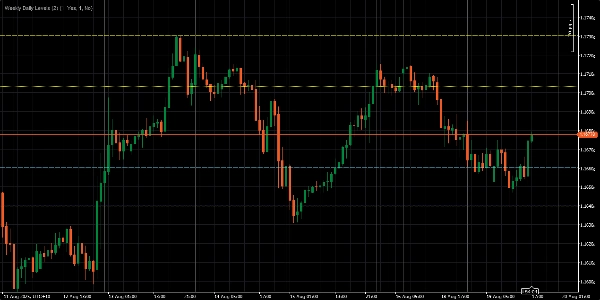
يقوم مؤشر المستويات الأسبوعية واليومية بالعمل الشاق نيابةً عنك. فهو يرسم تلقائيًا أسعار الافتتاح، الأعلى، الأدنى، الإغلاق (OHLC)، ونقطة المنتصف لليوم السابق والأسبوع السابق مباشرة على الرسم البياني الخاص بك. هذا يعني أنه يمكنك التركيز على تنفيذ استراتيجيتك بينما يتولى المؤشر التفاصيل—مما يجعل تداولك أبسط وأسرع وأكثر كفاءة بكثير.
الميزات الرئيسية:
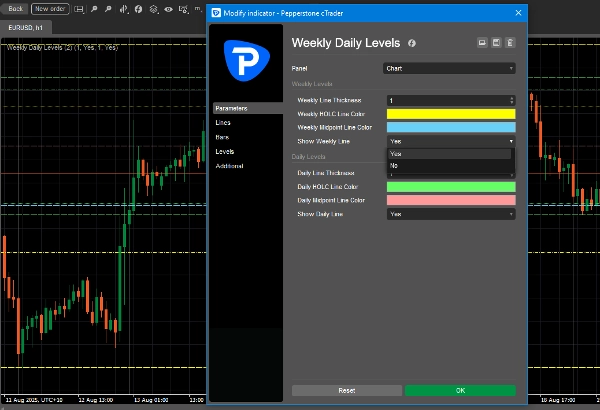
- يعرض فورًا أسعار OHLC اليومية والأسبوعية ونقطة المنتصف.
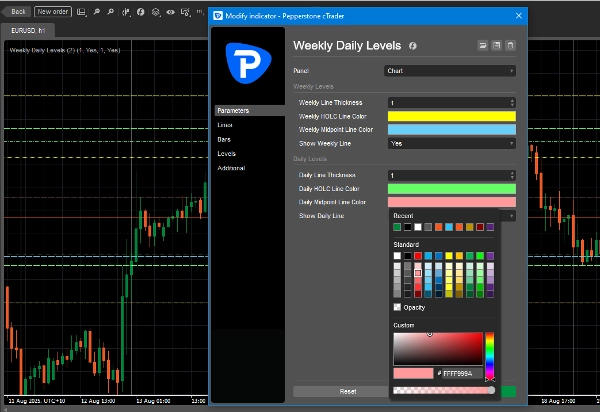
- خصص ألوان الخطوط لتتناسب مع نمط الرسم البياني الخاص بك.
- قم بتشغيل أو إيقاف المستويات اليومية أو الأسبوعية بنقرة واحدة.
- اضبط سمك الخط لتحسين الرؤية.
الملخص
ملخص الذكاء الاصطناعي
The Weekly Daily Levels indicator automatically plots the previous day’s and previous week’s open, high, low, close (OHLC) prices along with their mid-points directly on trading charts. It provides instant visual reference to these key price levels, helping traders incorporate daily and weekly price data into their strategies without manual marking. Users can customize line colors and thickness to fit their chart style and toggle daily or weekly levels on or off with a single click. This indicator streamlines the process of tracking important historical price levels for improved trading efficiency.
ملف تعريف المؤشر
تقييمات العملاء
5.0
التقييمات: 2
5 | 100 % | |
4 | 0 % | |
3 | 0 % | |
2 | 0 % | |
1 | 0 % |
تقييمات العملاء
August 28, 2025
Not bad if the rules are already clear. Two timeframes give more context.
August 21, 2025
the good surprise is the setup needs less second guessing, and It works better with a written plan.
مناقشة
الأسئلة الشائعة
يتم توفير المنتجات المتاحة من خلال cTrader Store، بما في ذلك روبوتات التداول والمؤشرات والإضافات، من قبل مطوري الطرف الثالث وإتاحتها لأغراض الوصول المعلوماتي والفني فقط. cTrader Store ليس وسيطًا ولا يقدم نصائح استثمارية أو توصيات شخصية أو أي ضمان للأداء المستقبلي.


![شعار "[Hamster-Coder] Bollinger Bands"](https://cdn.ctrader.com/image/webp/21d8e5d6-fb11-4bac-b9ee-cd05c2b76804_30327)

السعر
منذ 19/04/2025
2
المبيعات