
الوصف
✅ خط اتجاه سلس يتغير لونه يتكيف فورًا مع الاتجاه
✅ أسهم اختيارية للأعلى والأسفل لإشارات واضحة لتغير الاتجاه
✅ يفلتر الضوضاء لتسليط الضوء على انتقالات اتجاه نظيفة وموثوقة
✅ مثالي لـ متابعة الاتجاه، والتراجعات، والانعكاسات
✅ قابل للتخصيص بالكامل: الفترة، الحساسية، وعرض الأسهم
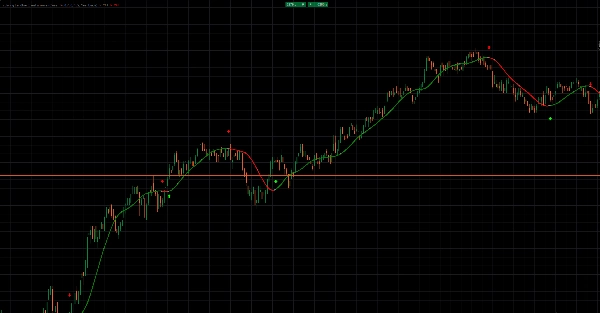
يقدم خط الاتجاه الملون مع الأسهم عرضًا سلسًا ومتجاوبًا لاتجاه السوق بدون فوضى.
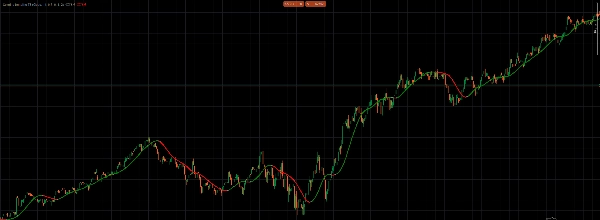
يتغير خط الاتجاه ديناميكيًا إلى اللون الأخضر في مراحل الصعود والأحمر في مراحل الهبوط، مما يجعل اتجاه الاتجاه قابلًا للقراءة فورًا.
عندما يتغير الزخم، تشير الأسهم الاختيارية إلى التغيير — أسهم خضراء للاتجاهات الصاعدة، وأسهم حمراء للاتجاهات الهابطة.
هذا يسمح لك بالتقاط نقاط تحول الاتجاه مبكرًا مع تجنب الإشارات الخاطئة الناتجة عن ضوضاء السوق.
مصمم للوضوح، يتكيف بسلاسة مع السعر مع الحفاظ على هيكل اتجاه قوي.
مثالي لتوقيت الدخول، إدارة الخروج، والبقاء متوافقًا مع الاتجاه السائد.
استخدمه كأداة اتجاه مستقلة أو دمجه مع استراتيجيتك الحالية لمزيد من التأكيد.
مرئيات نظيفة. إشارات واضحة. تداول اتجاه بثقة.
الملخص
تقييمات العملاء
5 | 0 % | |
4 | 100 % | |
3 | 0 % | |
2 | 0 % | |
1 | 0 % |


