
الوصف
✅ يكتشف نقاط التحول ذات الاحتمالية العالية والمنخفضة باستخدام منطق المحور المتقدم
✅ محركات العمق والانحراف والخطوة الخلفية قابلة للتخصيص بالكامل
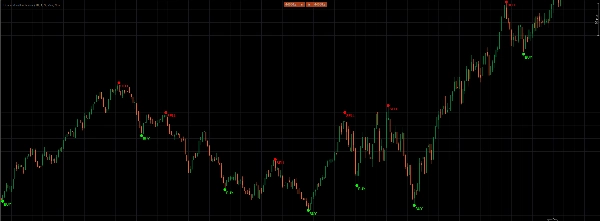
✅ يرسم تلقائيًا تسميات شراء وبيع واضحة على الرسم البياني
✅ علامات المحور والإبرازات الحالية اختيارية لمزيد من الوضوح
✅ مصمم لالتقاط الانعكاسات المبكرة بدقة وثقة
أطلق العنان للتداول الدقيق مع مؤشر الشراء والبيع: محرك إشارة قوي قائم على المحاور يكتشف نقاط التحول العالية والمنخفضة باستخدام إعدادات العمق والانحراف والخطوة الخلفية القابلة للتخصيص. قم بتكوين DepthEngine وDeviationEngine وBackstepEngine لضبط الحساسية بدقة، ثم دع المؤشر يرسم تلقائيًا تسميات "شراء" و"بيع" واضحة—مع علامات المحور والبار الحالي الاختيارية بألوانك المفضلة—حتى لا تفوت أي انعكاس للاتجاه مرة أخرى! تداول بذكاء، وليس بصعوبة.
الملخص
تقييمات العملاء
5 | 33 % | |
4 | 67 % | |
3 | 0 % | |
2 | 0 % | |
1 | 0 % |


