
الوصف
يشمل التنعيم Jurik ثلاث مراحل:
المرحلة الأولى - التنعيم التمهيدي بواسطة EMA التكيفية: MA1 = (1-alpha)*Price + alpha*MA1[1];
المرحلة الثانية - تنعيم تمهيدي إضافي بواسطة مرشح كالمان: Det0 = (Price - MA1)*(1-beta) + beta*Det0[1]; MA2 = MA1 + PR*Det0;
المرحلة الثالثة - التنعيم النهائي بواسطة مرشح Jurik التكيفي الفريد: Det1 = (MA2 - JMA[1]) * (1-alpha)^2 + alpha^2 * Det1[1]; JMA = JMA[1] + Det1;
حيث: - Price - سلسلة الأسعار - alpha - عامل ديناميكي (سيتم شرحه أدناه) - beta - النسبة الدورية = 0.45*(Length-1)/(0.45*(Length-1)+2) - PR - نسبة الطور: PR = Phase/100 + 1.5 (إذا كانت Phase < -100 فإن PR=0.5، إذا كانت Phase > 100 فإن PR=2.5).
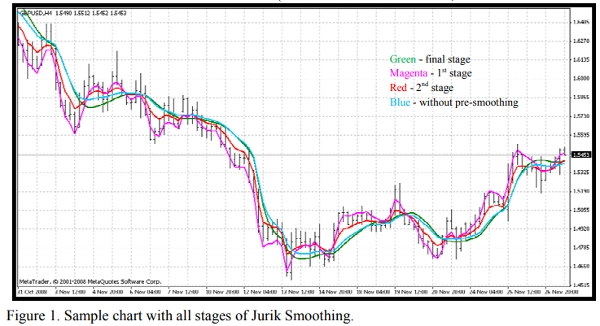
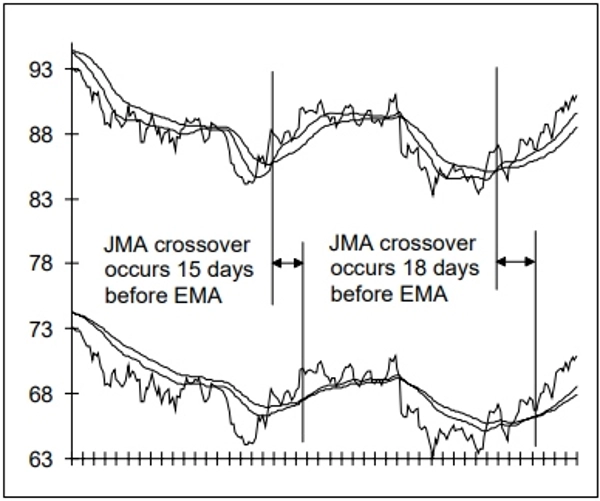
الشكل 1. مخطط نموذجي مع جميع مراحل تنعيم Jurik. يمكنك رؤية النتائج (الشكل 1) لكل مرحلة من خلال المؤشر المرفق JurikFilter_v2، بتغيير FilterMode: 0 - المرحلة النهائية (JMA) 1 - المرحلة الأولى 2 - المرحلة الثانية 3 - التنعيم النهائي فقط (بدون تمهيدي).
العامل الديناميكي هو عامل دوري (beta) مرفوع إلى قوة (pow):
alpha = beta ^ Pow،
حيث: - pow = rVolty ^ pow1 - rVolty - تقلب السعر النسبي - pow1 - قوة التقلب النسبي مع الصيغة التالية: pow1 = len1 - 2 (إذا كان pow1 < 0.5 فإن pow1 = 0.5)،
حيث len1 - عامل دوري إضافي: len1 = Log(SquareRoot(len))/Log(2.0) + 2 (إذا كان len1 < 0 فإن len1 = 0).
لذا يمكنك أن ترى أن العامل الديناميكي يعتمد على تقلب السعر النسبي مما يوفر التكيف المطلوب لهذا النوع من مرشحات السعر.
الصيغة لتقلب السعر النسبي هي rVolty = Volty/AvgVolty (إذا كان rVolty > len1^(1/pow1) فإن rVolty = len1^(1/pow1)، إذا كان rVolty < 1 فإن rVolty = 1)،
حيث:
- Volty - تقلب السعر بناءً على حساب ما يسمى بأشرطة Jurik (VisualMode = 1).
- AvgVolty - متوسط التقلب الذي يستخدم Jurik خوارزمية حساب معقدة إلى حد ما: AvgVolty = Average(vSum,AvgLen)،
حيث:
- vSum - مجموع تزايدي لـ (Volty - Volty[10])/10؛
- AvgLen - فترة المتوسط (يستخدم Jurik القيمة 65).
في نسختي من مرشح Jurik أستخدم المتوسط البسيط بدلاً من المتوسط المعقد لـ Jurik
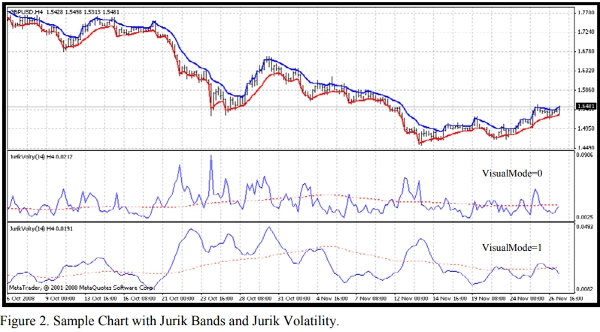
علاوة على ذلك، مع المؤشر المرفق JurikVolty_v1 (الشكل 2) يمكنك رؤية القيم لـ Volty (VisualMode=0)، vSum (VisualMode=1) و AvgVolty (الخط المنقط الأحمر).
الصيغة لتقلب السعر هي Volty = الحد الأقصى بين Abs(del1) و Abs(del2)، إذا كان Abs(del1) = Abs(del2) فإن Volty = 0،
حيث: - del1 - المسافة بين السعر والحد العلوي del1 = Price - UpperBand - del2 - المسافة بين السعر والحد السفلي del2 = Price - LowerBand أشرطة Jurik تختلف عن أي أشرطة سعر معروفة مثل Bollinger، Keltner، Donchian، Fractal وهكذا: إذا كان del1 > 0 فإن UpperBand = Price وإلا UpperBand = Price - Kv*del1 إذا كان del2 < 0 فإن LowerBand = Price وإلا LowerBand = Price - Kv*del2،
حيث: - Kv - عامل التقلب Kv = bet ^ SquareRoot(pow2). من السهل أن ترى أن هذه الأشرطة يمكن أن تكون أساسًا لمؤشر تتبع الاتجاه مثل Wilder's Parabolic. لذا، يمكنك أن ترى أننا عمليًا لا نملك أماكن غامضة في خوارزمية المتوسط المتحرك Jurik (JMA)
الملخص
تقييمات العملاء
5 | 0 % | |
4 | 100 % | |
3 | 0 % | |
2 | 0 % | |
1 | 0 % |


