
GUPPY-MASTER V3
مؤشر
251 التنزيلات
الإصدار 1.0، Mar 2026
Windows, Mac
5.0
التقييمات: 3
منذ 27/02/2026
33.16K
حجم التداول
25.96K
الربح بالبيب
8
المبيعات
391
التثبيتات المجانية
الوصف
GUPPY TREND MASTER V3 (4X4 TRADING TECHNOLOGY )
تصور معنويات السوق باستخدام قوس قزح 38-EMA
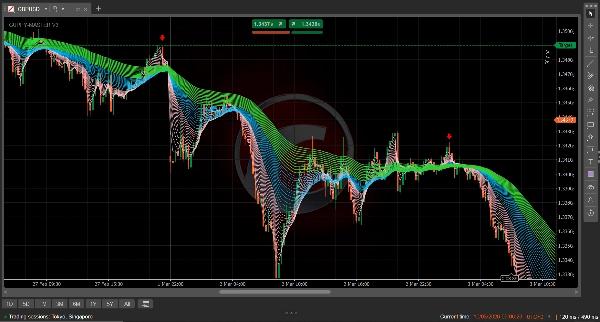
الGuppy Trend Master 4X4 هو أداة تحليل فني متميزة لمنصة cTrader تحول حركة السعر المعقدة إلى خريطة واضحة وملونة لسيكولوجية السوق. من خلال رسم 38 متوسطًا متحركًا أسيًا (EMA) في نفس الوقت، يسمح للمتداولين بالتمييز بين "الضوضاء" المؤقتة والانعكاسات الحقيقية للاتجاه.
المنطق البصري 4X4
يقوم المؤشر بتنظيم بيانات السوق في ثلاث "شرائط" مميزة ليمنحك رؤية متعددة الأبعاد للاتجاه:
- الشريط الوردي (الفترات 2–15): مجموعة "المضاربين". تمثل هذه الخطوط المتداولين قصيري الأجل. عندما تتوسع، يكون الزخم عاليًا. وعندما تنضغط، يكون التحرك منهكًا.
- الشريط الأزرق (الفترات 17–41): مجموعة "الجسر". تعمل كمنطقة انتقال حرجة. غالبًا ما تخدم كمنطقة "ارتداد" لإعادة الدخول خلال اتجاه قوي.
- الشريط الأخضر (الفترات 44–74): مجموعة "المستثمرين". تمثل المعنويات طويلة الأجل. يشير الشريط الأخضر الواسع والمتوسع إلى اتجاه قوي ومستقر يصعب كسره.
لماذا تستخدم المؤشر؟
- تأكيد الاتجاه الفوري: شاهد بسرعة إذا كان السوق يتجه أو يتراوح. إذا كانت الشرائط متشابكة، ابتعد. إذا كانت متفرقة ومنفصلة، فالاتجاه قوي.
- مناطق السكالبينج الدقيقة: محسنة خصيصًا للأطر الزمنية M1 و M5، يبرز 4X4 مناطق "شراء عند الهبوط" و "بيع عند الارتفاع" بدقة جراحية.
- تصور التقلبات: "الفجوة" بين الشرائط تخبرك بمدى الإقناع وراء الحركة. "الفجوات الواضحة" (كما هو موضح في منطق 4X4) تشير إلى بيئة تداول عالية الاحتمالية.
- منطق بدون تأخير: باستخدام المتوسطات المتحركة الأسية (EMA)، يتفاعل 4X4 مع تغيرات السعر أسرع من مؤشرات Guppy القائمة على المتوسط المتحرك البسيط (SMA)، مما يجعله متفوقًا للأسواق الحديثة عالية التردد.
كيفية قراءة الإشارة
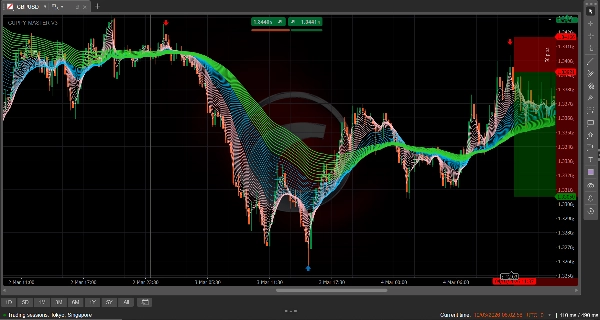
- قوة صعودية: الوردي في الأعلى، يليه الأزرق، والأخضر في الأسفل. جميع المجموعات تتوسع لأعلى مع وجود فراغ واضح بين الخطوط.
- قوة هبوطية: الأخضر في الأعلى، يليه الأزرق، والوردي في الأسفل. جميع المجموعات تتوسع لأسفل.
- الضغط: عندما تتقارب المجموعات الثلاث كلها في نقطة واحدة، يكون انفجار ضخم وشيك.
الملخص
ملخص الذكاء الاصطناعي
The GUPPY TREND MASTER V3 is a technical analysis indicator designed for the cTrader platform that visualizes market sentiment using 38 Exponential Moving Averages (EMAs). It organizes these EMAs into three color-coded ribbons to provide a multi-dimensional view of market trends: the Pink Ribbon (periods 2–15) reflects short-term speculator activity, the Blue Ribbon (periods 17–41) serves as a transitional bridge zone, and the Green Ribbon (periods 44–74) indicates long-term investor sentiment. This structure helps traders distinguish between market noise and genuine trend reversals.
Key features include instant trend confirmation by observing ribbon separation or entanglement, precision scalping zones optimized for 1- and 5-minute timeframes, and visualization of market volatility through the spacing between ribbons. The use of EMAs ensures faster reaction to price changes compared to traditional SMA-based Guppy indicators, supporting high-frequency trading environments.
Signal interpretation is based on ribbon positioning and spacing: bullish trends show Pink above Blue above Green with upward fanning, bearish trends show the reverse with downward fanning, and convergence of all ribbons signals an imminent breakout. The indicator supports various markets including forex pairs (GBPUSD, USDJPY), cryptocurrencies, stocks, and commodities like gold (XAUUSD).
ملف تعريف المؤشر
تقييمات العملاء
5.0
التقييمات: 3
5 | 100 % | |
4 | 0 % | |
3 | 0 % | |
2 | 0 % | |
1 | 0 % |
تقييمات العملاء
March 29, 2026
This is a nice indicator 😀. Overall the images are what is represented on the chart no faking. But only the arrows missing. Let me hope version 2 has them.
March 17, 2026
Very good 👍👍 indicator. Have looked for it every where finally I found it works every well
مناقشة
الأسئلة الشائعة
Signal
Breakout
Scalping
GBPUSD
Crypto
Stocks
XAUUSD
NAS100
USDJPY
يتم توفير المنتجات المتاحة من خلال cTrader Store، بما في ذلك روبوتات التداول والمؤشرات والإضافات، من قبل مطوري الطرف الثالث وإتاحتها لأغراض الوصول المعلوماتي والفني فقط. cTrader Store ليس وسيطًا ولا يقدم نصائح استثمارية أو توصيات شخصية أو أي ضمان للأداء المستقبلي.
المزيد من هذا المؤلف


السعر
منذ 27/02/2026
33.16K
حجم التداول
25.96K
الربح بالبيب
8
المبيعات
391
التثبيتات المجانية