
Description
Prévision des prix basée sur le MACD
Aperçu
Cet indicateur dépasse les limites du MACD traditionnel en allant au-delà de l'analyse historique, introduisant de manière innovante la mémoire historique et les algorithmes statistiques pour prévoir l'évolution future des prix.
Mécanismes principaux :
- Mémoire des tendances historiques : L'indicateur enregistre le déplacement des prix des tendances MACD passées (à la fois haussières et baissières) par rapport à leurs points de départ, construisant une base de données statistique de jusqu'à 50 tendances récentes.
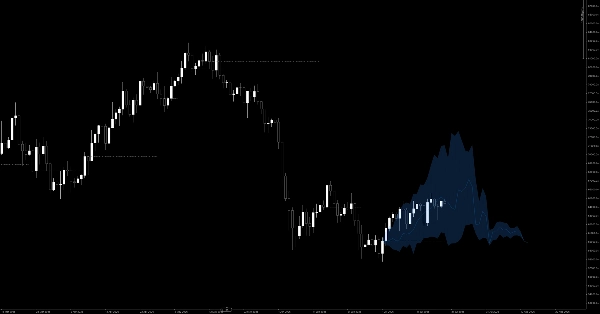
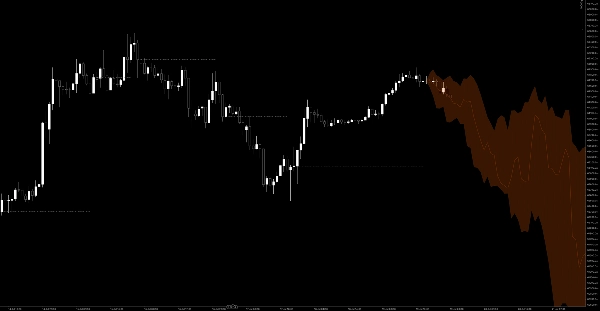
- Éventail de prévision probabiliste : Lorsqu'un nouveau croisement MACD se produit (qu'il traverse la ligne zéro ou la ligne de signal), l'indicateur récupère les données de la mémoire historique. Il calcule les percentiles à 20 %, 50 % et 80 % des variations de prix et projette un éventail de prévision probabiliste pour les 100 barres suivantes sur le côté droit du graphique.
- Nuage dynamique de la zone de signal : Il marque le "Prix de référence" où l'inversion de tendance a commencé. Lorsque le prix en temps réel est au-dessus de ce prix de référence dans une tendance haussière, il peint une zone de nuage verte ; inversement, il peint un nuage rouge dans une tendance baissière. Cela fournit une confirmation visuelle immédiate de l'élan haussier ou baissier réel.
(Note : Cet indicateur dispose d'un rendu graphique hautement optimisé, utilisant un mélange polygonal sans couture pour des zones visuelles claires et une ligne de référence discontinue raffinée pour une expérience graphique incroyablement propre.)
Règles de trading & Guide utilisateur
Cet indicateur va au-delà des simples signaux "acheter/vendre au croisement" — il vous fournit une feuille de route probabiliste pour vos trades.
1. Trouver les entrées (Confirmation de tendance)
- Entrées longues : Lorsqu'un croisement MACD haussier se produit, un éventail de prévision bleu projetant vers le haut apparaîtra à droite. Ne vous précipitez pas aveuglément. Attendez de voir si le prix se stabilise au-dessus de la ligne point-trait (Prix de référence) et si un nuage haussier vert commence à s'étendre. Cela confirme que l'élan actuel correspond aux statistiques historiques haussières, offrant une opportunité solide d'acheter la baisse.
- Entrées courtes : Lorsqu'un croisement MACD baissier se produit, un éventail de prévision orange projetant vers le bas apparaîtra. Cherchez à ce que le prix reste en dessous de la ligne de référence avec un nuage baissier rouge en expansion pour confirmer une entrée courte lors d'un repli.
2. Fixer les objectifs de prise de profit
L'éventail de prévision sert d'excellent guide dynamique pour la prise de profit :
- Objectif 1 (La ligne médiane) : La ligne médiane à l'intérieur de l'éventail représente le percentile historique à 50 % (la trajectoire moyenne). Lorsque le prix touche cette ligne, cela signifie que le mouvement actuel a atteint la moyenne historique, ce qui en fait un endroit idéal pour prendre des profits partiels.
- Objectif 2 (Les bords extérieurs de l'éventail) : La limite supérieure (percentile à 80 %) ou la limite inférieure (percentile à 20 %) représente les extrêmes historiques. Si le prix atteint ces bords, l'élan est fortement épuisé, et un renversement ou un repli profond est très probable. Envisagez de clôturer la position entière.
3. Placement scientifique du stop loss
- La ligne grise en pointillés (Prix de référence) sert de base pour chaque tendance.
- Lors d'une position longue, placez votre stop loss légèrement en dessous de cette ligne grise. Si le prix casse à travers le prix de référence et que le nuage vert disparaît, cela signifie que l'action réelle du prix a invalidé la probabilité haussière historique. La configuration de la tendance a échoué, et vous devez couper vos pertes immédiatement.
4. Filtre de marché en range
- Si un croisement MACD se produit mais que l’ éventail de prévision projeté apparaît très plat ou contracté, cela signifie qu’historiquement, des croisements similaires n’ont abouti qu’à une action choppy et latérale.
- Lorsque vous voyez un éventail plat, restez inactif et évitez de trader. Attendez le prochain cycle où l’éventail montre une expansion claire vers le haut ou vers le bas.
Résumé
Key features include a probability forecasting fan that projects 20%, 50%, and 80% price change percentiles for the next 100 bars following a MACD crossover. The indicator visually displays this fan on the chart, with blue fans for bullish signals and orange for bearish. A dynamic signal area cloud highlights momentum: green for confirmed uptrends above a reference price and red for downtrends below it.
Trading guidance involves waiting for price confirmation above or below the reference price and cloud before entering long or short positions. The forecasting fan also serves as a dynamic take-profit guide, with the middle line representing average historical moves and outer edges indicating potential trend exhaustion. Stop-loss placement is recommended just beyond the reference price line to manage risk.
Additionally, the indicator filters ranging markets by identifying flat or contracted fans, signaling sideways price action and advising traders to avoid entering trades during such periods. The indicator supports visualization outputs and is tagged under MACD and momentum indicators.