
Description
QX SmartStructure (QX SS)
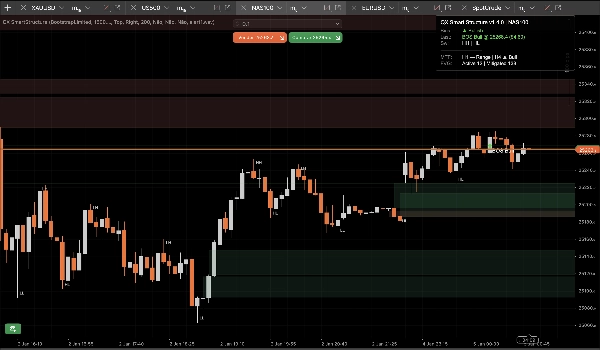
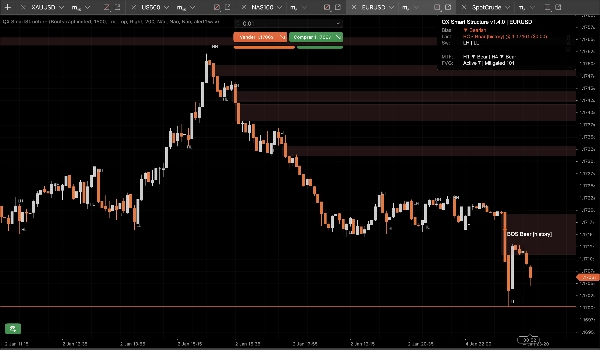
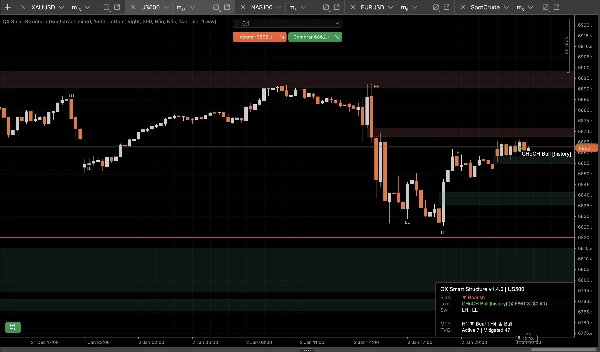
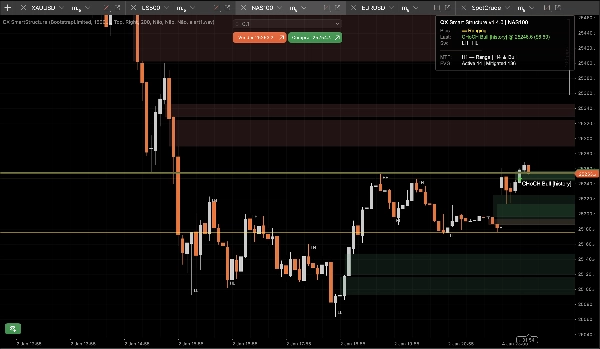
QX SmartStructure (QX SS) est une superposition SMC légère à bord dur droit pour cTrader. Il affiche la structure actuelle, les ruptures BOS/CHoCH, les zones FVG filtrées et automatiquement gérées, ainsi qu'un panneau de biais MTF compact H1/H4 pour que vous arrêtiez de changer de périodes.
Outil de visualisation uniquement. Il ne passe pas d'ordres.
Ce qu'il affiche
1) Structure de marché claire (bord dur droit)
- Étiquettes de swing : HH / HL / LH / LL
- Niveaux clés : dernier sommet de swing confirmé et dernier creux de swing confirmé
- Événements de rupture : BOS / CHoCH avec force (Fort vs Faible)
- Modes d'affichage :
-
- ActiveOnly (minimal)
- RecentSwings (contexte contrôlé)
2) Zones FVG sous contrôle
- Rectangles FVG haussiers et baissiers
- Taille min FVG (pas) le filtre supprime automatiquement les micro-trous
- Règle d'atténuation à 50 % (basée sur la mèche) : une zone devient atténuée lorsque le prix atteint son niveau médian
- Cycle de vie :
-
- Masquage automatique des zones atténuées = ACTIVÉ pour un graphique le plus propre possible
- DÉSACTIVÉ garde les zones atténuées comme contexte “fantôme” (opacité réduite)
- Des limites strictes empêchent le spam d'objets sur de longues sessions (stocké/dessiné/extension à droite)
3) Panneau de biais MTF (H1 / H4)
Un panneau compact affiche :
- Biais de la période actuelle : Haussier / Baissier / Latéral / Inconnu
- Dernier événement : BOS/CHoCH, direction, force
- Instantanés optionnels : biais H1 et biais H4
4) Alertes sonores optionnelles
Alertes sonores uniquement pour les ruptures, avec :
- Optionnel alerte sur ruptures faibles
- Nom de fichier sonore personnalisé
L'avantage StepSize (FX, Or, Indices)
La plupart des outils de structure échouent lorsque vous changez de symbole car ils supposent que “pips” signifie la même chose partout.
QX SS utilise StepSize comme unité universelle : TickSize → PipSize → Chiffres de secours
Convertir toute distance en pas
pas = distance_prix ÷ TickSize
Exemples (tailles de tick courantes) :
- EURUSD TickSize 0.00001 : 1 pip (0.00010) = 10 pas
- XAUUSD TickSize 0.01 : 0,10 $ = 10 pas, 1,00 $ = 100 pas
- Les indices varient selon le courtier :
Où trouver TickSize
- Dans cTrader Automate : Symbol.TickSize (QX SS le lit en toute sécurité)
- Dans l'interface de la plateforme : panneau de spécification du symbole (informations du symbole dans Market Watch)
Taille min FVG recommandée (pas)
Ce sont des plages de départ pratiques, pas une vérité universelle. La volatilité et la session comptent.
M15 (flux de travail par défaut)
- EURUSD : 20–40 pas (≈ 2–4 pips si TickSize = 0.00001)
- XAUUSD : 30–120 pas (≈ 0,30 $–1,20 $ si TickSize = 0.01)
- US500 / NAS100 : choisissez un mouvement significatif en points, puis convertissez :
M5 (oui, ça change)
M5 affiche plus de micro-trous. Si vous gardez la même valeur MinFVGSteps, vous filtrerez trop.
Ajustement typique : réduisez MinFVGSteps d'environ 30–50% par rapport à votre valeur M15, puis réajustez.
“Latéral” n'est pas un bug !
Le biais devient Latéral lorsque les derniers sommets/creux de swing ne s'alignent pas clairement comme HH+HL ou LH+LL.
Dans un marché choppy, un outil qui reste “Haussier” indéfiniment ment. QX SS est conservateur par conception.
Préréglages (points de départ)
Préréglage A : “M15 Équilibré” (par défaut recommandé)
- Force du swing (M15=7) : 7
- Type de rupture : Clôture
- Confirmé uniquement : vrai
- Mode d'affichage : RecentSwings
- Nombre de swings récents : 30
- Taille min FVG (pas) : EURUSD 25 | XAUUSD 60 | Indices 15 (puis ajustez)
- Masquage automatique des zones atténuées : vrai
- Max FVG dessiné : 30
- Extension des barres à droite : 50
- Afficher MTF H1 : vrai
- Afficher MTF H4 : vrai
Préréglage B : “M15 Graphique propre”
- Mode d'affichage : ActiveOnly
- Afficher les étiquettes de swing : faux
- Masquage automatique des zones atténuées : vrai
- Max FVG dessiné : 15–20
- (Gardez le reste du préréglage A)
Préréglage C : “Contexte scalp M5”
- Force du swing : 5–6
- Type de rupture : Les deux
- Confirmé uniquement : vrai (démarrage strict)
- Afficher les ruptures faibles : faux
- Taille min FVG (pas) : ~50–70% de votre valeur M15
- Nombre de swings récents : 20–30
- Extension des barres à droite : 30–50
Intégration cBot / automatisation (ce que QX SS expose)
QX SmartStructure expose 3 séries internes pour les cBots :
- BiasSeries : 1 haussier, -1 baissier, 0 sinon
- BreakSignalSeries : 1 rupture haussière, -1 rupture baissière, 0 sinon
- BreakLevelSeries : niveau de prix sur la barre d'événement, NaN sinon (sentinelle propre)
Stabilité et performance (v1.5.1+)
Conçu pour les configurations multi-graphiques et les longues sessions :
- Traite uniquement sur nouvelles barres fermées
- Mises à jour UI limitées par UI Throttle (ms) pour garder le CPU bas
- Comptes d'objets contrôlés et limites de taille empêchent le spam sur le graphique
- Détecte en toute sécurité les “rechargements durs” réels (rechargement période/symbole/historique) et reconstruit l'état sans dérive
Nouvelles options de sécurité (v1.5.1+)
Invalidation sur saut de gap (activé par défaut)
Si le prix fait un gap et saute par-dessus une zone FVG sans la toucher (ouverture weekend/actualités), la zone est marquée Invalidée par Gap au lieu de rester active.
Cela empêche les zones obsolètes de rester sur le graphique après des ouvertures violentes.
Effacement complet des séries lors de la reconstruction (désactivé par défaut)
Lors d'une reconstruction dure, effacez éventuellement tout l'historique des séries de sortie exposées pour une cohérence maximale des backtests/exportations.
Gardez DÉSACTIVÉ pour de meilleures performances sur de très grands historiques. Activez ACTIVÉ uniquement pour des workflows de backtest approfondis nécessitant une intégrité historique complète.
Paramètres recommandés par défaut
- Invalidation sur saut de gap : Oui (ACTIVÉ)
- Effacement complet des séries lors de la reconstruction : Non (DÉSACTIVÉ)
Avertissement
Cet outil est uniquement destiné à la visualisation et au support à la décision. Le trading comporte des risques. Utilisez toujours votre propre gestion des risques.
Résumé
It automatically detects and manages Fair Value Gap (FVG) zones, filtering out micro-gaps based on a configurable minimum size measured in steps, a universal unit derived from the symbol’s TickSize. The indicator applies a 50% mitigation rule to mark zones as mitigated when price reaches their midpoint, with options to auto-hide or display mitigated zones as ghosted.
QX SmartStructure includes a compact multi-timeframe (MTF) bias panel showing current timeframe bias (Bullish, Bearish, Ranging, or Unknown) and recent break events for H1 and H4 timeframes. Optional sound alerts notify users of break events, including weak breaks.
The tool supports various markets such as Forex, commodities (e.g., gold), indices, and cryptocurrencies by adapting to symbol-specific TickSize values. It exposes internal data series for integration with cBots and is optimized for performance with controlled object counts and throttled updates. The indicator does not place trades and is intended for decision support only.
Avis clients
5 | 100 % | |
4 | 0 % | |
3 | 0 % | |
2 | 0 % | |
1 | 0 % |


