
الوصف
مؤشر ضغط الشمعة QX هو طبقة ضغط الشمعة لمنصة cTrader تساعد المتداولين على قراءة مدى قوة إغلاق كل شمعة ضمن نطاقها الخاص.
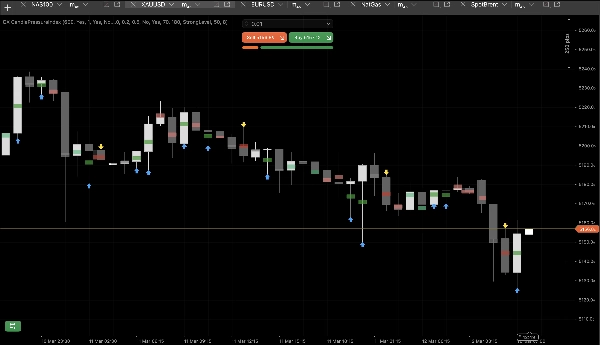
بدلاً من استخدام نافذة مذبذب منفصلة، يعرض CPI الضغط مباشرة على الرسم البياني الرئيسي من خلال علامات منتصف النقطة المدمجة. هذا يجعل من الأسهل قراءة قوة الإغلاق، التحيز الصعودي أو الهبوطي، والزخم قصير الأجل مع ضوضاء بصرية أقل.
الاستخدامات الرئيسية
تم تصميم CPI لمساعدة المتداولين على:
- تقييم جودة إغلاق الشمعة
- تأكيد الضغط الاتجاهي
- تقييم قوة الاختراق
- قراءة التراجعات بشكل أوضح
- رصد تحولات الزخم مبكراً
كيف يعمل
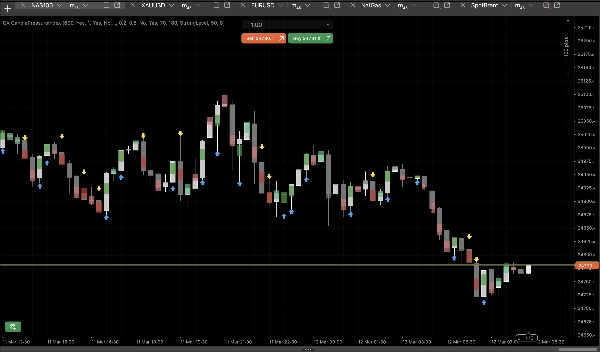
يتم تصنيف كل شمعة حسب مكان إغلاقها داخل نطاقها الخاص:
- قريب من الأعلى = ضغط صعودي
- قريب من الأدنى = ضغط هبوطي
- قريب من المنتصف = ضغط محايد
يتم عرض هذه المعلومات باستخدام:
- علامات ضغط منتصف النقطة
- 5 مناطق ضغط
- أسهم اختيارية للضغط القوي
- طبقة اختيارية على جسم الشمعة
مناطق الضغط
يقسم CPI الشموع إلى 5 حالات بصرية:
- شراء قوي
- شراء معتدل
- محايد
- بيع معتدل
- بيع قوي
هذا يساعد المتداولين على تحديد ما إذا كانت الحركة قوية، ضعيفة، أو متوازنة.
الميزات الرئيسية
علامات ضغط منتصف النقطة
علامات بصرية مدمجة مثبتة في منتصف الشمعة.
5 مناطق ضغط
فصل واضح بين الإغلاقات القوية، المعتدلة، والمحايدة.
تخطي الشمعة المتشكلة
يتجاهل الشمعة الحية حتى تغلق لقراءات أكثر استقراراً.
إخفاء العلامات المحايدة
يحافظ على نظافة الرسم البياني من خلال عرض الشموع الاتجاهية فقط.
أنماط الأسهم
يسلط الضوء بصرياً على الشموع الصعودية أو الهبوطية القوية.
طبقة الجسم
يضيف طبقة إضافية خفيفة لتسهيل قراءة الرسم البياني.
المعلمات الرئيسية وكيفية استخدامها
رسم الشموع السابقة
يتحكم في عدد الشموع الماضية المعروضة.
تخطي الشمعة المتشكلة
تشغيل لقراءة الشمعة المغلقة وإشارات أكثر استقراراً.
العتبة المعتدلة
يحدد متى تتوقف الشمعة عن كونها محايدة.
العتبة القوية
يحدد متى يصبح الضغط قوياً.
إخفاء العلامات المحايدة
يستخدم لعرض اتجاهي أنظف.
وضع السهم
اختر بين عدم وجود أسهم، أسهم على كل شمعة قوية، أو أسهم فقط على التحولات القوية.
مقياس العلامة / العرض / الشفافية
اضبط المظهر البصري ليتناسب مع نمط الرسم البياني الخاص بك.
أفضل استخدام لـ
- تأكيد استمرار الاتجاه
- تقييم جودة الاختراق
- تحليل التراجع
- قراءة الزخم قصير الأجل
- تفسير حركة السعر بشكل أنظف
ملخص
مؤشر ضغط الشمعة QX هو أداة بصرية نظيفة للمتداولين الذين يرغبون في قراءة ضغط الشمعة مباشرة على الرسم البياني، دون إضافة نافذة مؤشر أخرى.
الملخص
تقييمات العملاء
5 | 50 % | |
4 | 50 % | |
3 | 0 % | |
2 | 0 % | |
1 | 0 % |


