
Açıklama
QX RiskShield, durdurma mesafesini tam pozisyon büyüklüğüne (Birimler ve Lotlar) dönüştüren, ayrıca R:R hedeflerinize dayalı SL/TP fiyat seviyelerini hesaplayan grafik üzerinde bir risk hesaplayıcısıdır. Minimum grafik karmaşası ile hızlı karar vermek için tasarlanmıştır.
Bu sadece bir göstergedir. Emir vermez.
Gördükleriniz:
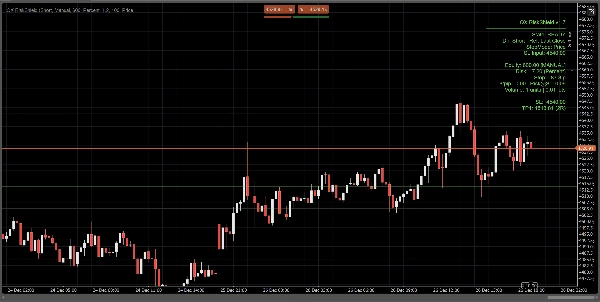
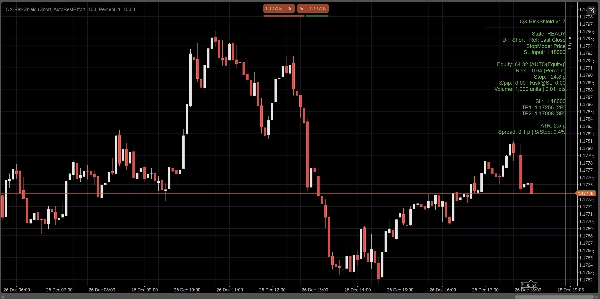
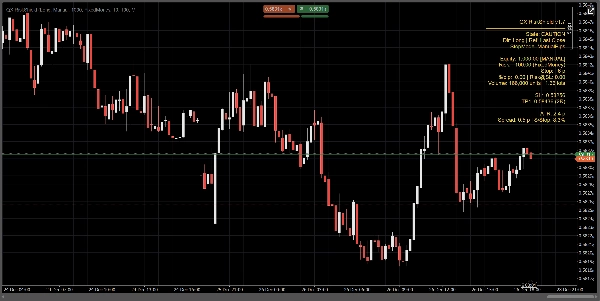
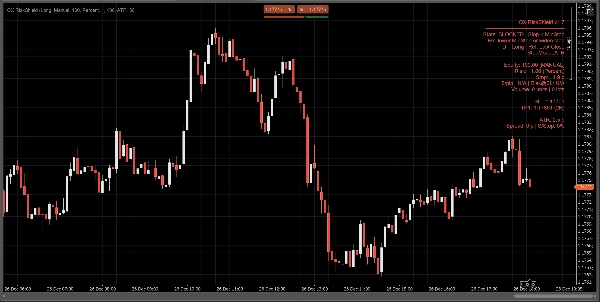
Kompakt bir panel, bir bakışta şunları gösterir:
- Durum: HAZIR / DİKKAT / ENGELLENDİ
- Sermaye kaynağı: Manuel veya Otomatik (en iyi çaba, güvenli geri dönüş)
- Risk miktarı: sermayenin %'si veya sabit para riski
- Durdurma mesafesi: pip cinsinden
- Pozisyon büyüklüğü: Birimler + Lotlar (broker kısıtlamalarına göre normalize edilmiştir)
- $/pip ve Risk@SL (durdurmada tahmini risk)
- SL / TP1 / TP2 fiyat seviyeleri (RR hedeflerinize göre)
- Opsiyonel Giriş / SL / TP çizgileri görsel referans için grafikte
Tüm hesaplamalar Son Kapanış (kararlı, bar içi titreme yok) baz alınarak yapılır.
Durdurma modları:
Durdurmanızın nasıl tanımlandığını seçin:
1) Manuel Pipler
Sabit bir durdurma mesafesi pip cinsinden ayarlayın.
2) ATR Durdurma
Durdurma mesafesi = ATR(pip) × ATR k.
Semboller arasında volatiliteye uyumlu boyutlandırma için faydalıdır.
3) Fiyat Durdurma
Tam SL fiyatını ayarlayın (discretionary trading için en iyisi).
RiskShield, bu fiyat mesafesini pip'e dönüştürür ve pozisyonu buna göre boyutlandırır.
Durum mantığı (karışıklık yok):
RiskShield, kullanıcıların ne olduğunu hemen anlaması için net durumlar kullanır:
HAZIR
Girdiler geçerlidir. Pozisyon boyutlandırması mevcuttur.
DİKKAT
Boyutlandırma geçerlidir, ancak RiskShield ATR'ye kıyasla sıkı bir durdurma tespit etti.
Bu bir uyarıdır, engelleme değildir.
ENGELLENDİ
Kurallar güvensiz veya geçersiz olduğunda boyutlandırma kasıtlı olarak devre dışı bırakılır, örneğin:
- Durdurma minimum durdurma eşiğinin altında
- SL fiyatı referans fiyatın yanlış tarafında
- Durdurmaya göre spread çok yüksek (Spread/Durdurma %)
- Hacim broker minimumunun altında olur
- Sembol pip/lot verisi mevcut değil
Girdileri hızlıca düzeltmek için kısa bir “Düzelt” ipucu gösterilebilir (opsiyonel).
Tüccarlar QX RiskShield'i nasıl kullanır (basit iş akışı)
- QX RiskShield'i grafiğinize ekleyin.
- İşlem Yönü seçin (Uzun veya Kısa).
- Risk Türü seçin:
-
- Sermayenin yüzdesi veya
- Her işlem için sabit para riski
- Durdurma Modu seçin:
-
- Manuel pipler, ATR veya SL Fiyatı
- Çıktıyı okuyun:
-
- Emir büyüklüğünüz için Birimler/Lotlar kullanın
- Referans fiyatlarınız olarak SL/TP seviyelerini kullanın
- Panel DİKKAT gösteriyorsa, durdurmayı genişletmeyi veya ATR modunu kullanmayı düşünün.
- Panel ENGELLENDİ gösteriyorsa, girdileri HAZIR olana kadar ayarlayın.
Kullanıcı arayüzü seçenekleri (temiz grafikler için tasarlandı):
- Panel Modu: Basit veya Pro
- Panel Yoğunluğu: Normal veya Kompakt (minimum metin için)
- Önerilen Düzeltmeyi Göster: Açık/Kapalı
- Çizgileri Göster: Açık/Kapalı
- Giriş Çizgisini Göster: Açık/Kapalı
- Panel hizalama kontrolleri ve performans için güncelleme sınırlaması
Performans ve kararlılık:
- Hesaplamalar için Son Kapanış kullanır. Yeniden çizim davranışı yoktur.
- Yoğun çalışma alanlarında CPU kullanımını azaltmak için güncelleme sınırlaması.
- Sembol verileri, broker kısıtlamaları ve eksik hesap alanları için savunmacı işlem.
Önemli notlar:
- QX RiskShield bir karar destek aracıdır, finansal tavsiye değildir.
- Sonuçlar broker sembol spesifikasyonlarınıza (pip değeri, lot büyüklüğü, minimum hacim vb.) bağlıdır.
- Otomatik sermaye en iyi çabadır. Platform erişimi kısıtlıysa, RiskShield güvenli bir şekilde manuel sermayeye geri döner.
İdeal olan:
- FX Majörleri ve endeks tüccarları
- Prop firma tarzı risk kuralları
- Hızlı boyutlandırma ve sıkı güvenlik kontrolleri isteyen scalperlar ve günlük tüccarlar
- Fiyat bazlı SL tercih eden ancak yine de otomatik boyutlandırma isteyen tüccarlar
Kontrol ile işlem yapın. Hassasiyetle boyutlandırın.
Özet
Müşteri değerlendirmeleri
5 | 0 % | |
4 | 100 % | |
3 | 0 % | |
2 | 0 % | |
1 | 0 % |


