
Açıklama
📊 TrendHeikinMultiMA – Gelişmiş Trend Algoritması
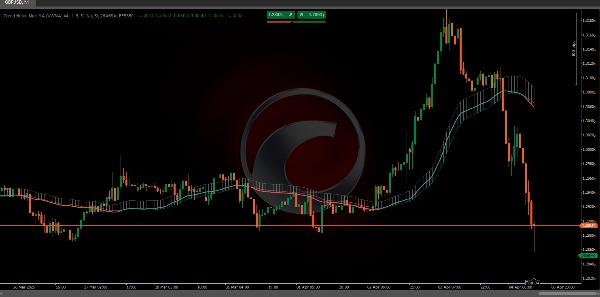
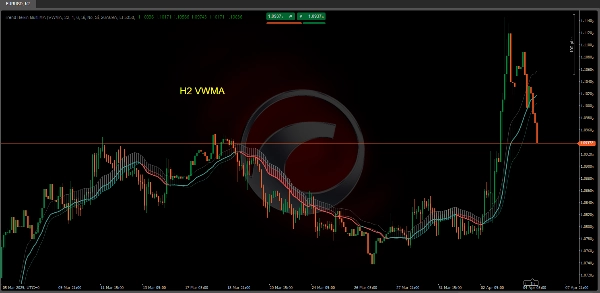
TrendHeikinMultiMA algoritması, fiyat verilerinden trend değerlerini hesaplamak için tasarlanmıştır, bu değerleri yumuşatmak için Heikin-Ashi formülünü kullanır ve farklı hareketli ortalama türlerini uygular (ALMA, HMA, SMA, SWMA, VWMA, WMA, ZLEMA veya EMA).
Her ne kadar Heikin-Ashi değerleri dahili olarak kullanılsa da, grafik geleneksel Heikin-Ashi mumlarını göstermez. Bunun yerine, yumuşatılmış değerlere dayalı trend çizgileri çizer ve böylece piyasa yönünü mum grafiğinin görsel karmaşıklığı olmadan daha kolay yorumlamayı sağlar.
🔄 1. Yumuşatmanın Rolü
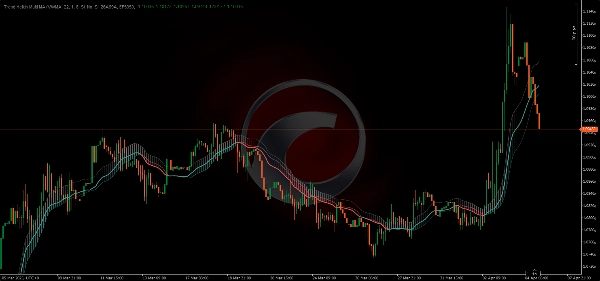
Trend değerleri, Heikin-Ashi yumuşatması ile hareketli ortalamanın birleşiminden elde edildiği için, TrendHeikinMultiMA'daki renk değişimi fiyat trend çizgisini geçtiğinde hemen gerçekleşmez:
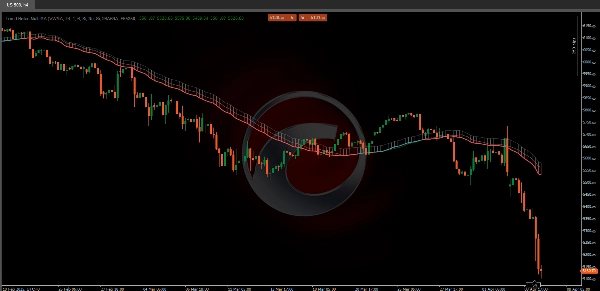
- 🔹 Fiyat, geçici olarak trend çizgisinin üstünde veya altında hareket edebilir ancak renk değişimini tetiklemez.
- 🔹 Bu, göstergenin yumuşatılmış açılış ve kapanış değerleri arasındaki anlamlı ve sürekli bir farkı bekleyerek gerçek bir trend dönüşünü onaylamasından kaynaklanır.
✅ Yorumlamada Avantaj
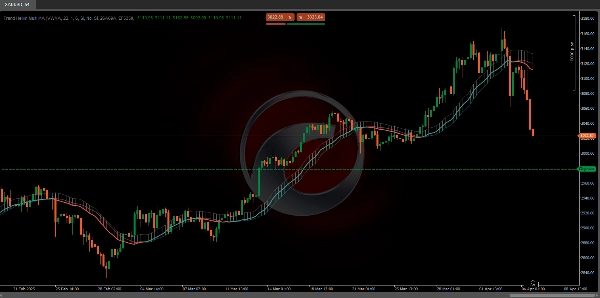
Bu bilinçli gecikme renk değişiminde yanlış sinyallerin önüne geçilmesine yardımcı olur. Geleneksel bir mum grafiğinde fiyat trend çizgisini kısa süreliğine geçip erken sinyaller tetikleyebilir.
- 🟥 Örneğin, mevcut fiyat düşüş trend çizgisinin üzerindeyse bile, gösterge kırmızı (düşüş) kalmaya devam eder, ta ki yumuşatılmış değerler kapanışın sürekli olarak açılıştan yüksek olduğunu doğrulayana kadar.
- 🟩 Benzer şekilde, yeşile (yükseliş) geçmek için Heikin-Ashi tabanlı hareketli ortalama, kapanışın sürekli olarak açılışı aştığını onaylamalıdır.
📈 2. Heikin-Ashi Değerlerine Hareketli Ortalamaların Uygulanması
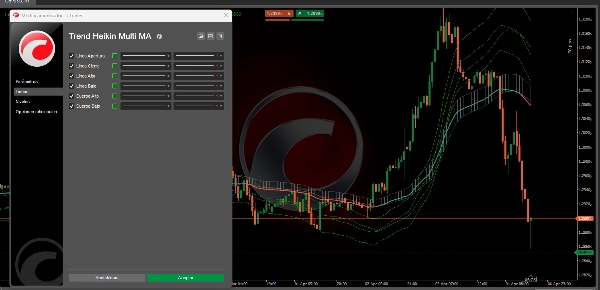
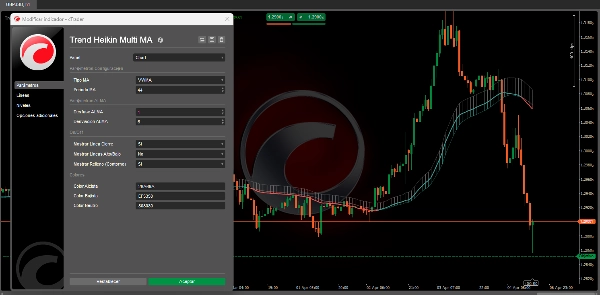
- 🔄 Hareketli Ortalama Seçimi:
-
- Kullanıcı, farklı hareketli ortalama türleri arasında seçim yapabilir (ALMA, HMA, SMA, SWMA, VWMA, WMA, ZLEMA ve EMA).
- Her MA türü, Heikin-Ashi'den türetilen açılış, kapanış, yüksek ve düşük değerlerinin tarihsel ağırlıklandırılması ve yumuşatılması için belirli bir matematiksel yöntem uygular.
🏆 3. TrendHeikinMultiMA Kullanmanın Geleneksel Mumlara Karşı Avantajları
- 📉 Gürültü Azaltma:
-
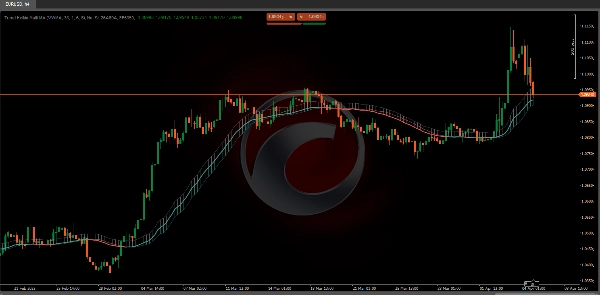
- Geleneksel mumlar genellikle yüksek volatilite ve dağınık veri gösterir, bu da genel trendi belirlemeyi zorlaştırır.
- TrendHeikinMultiMA bu verileri yumuşatır, küçük dalgalanmaları filtreler ve ani hareketleri ortadan kaldırır, yatırımcıların ana piyasa yönüne odaklanmasını sağlar.
✅ Sonuç
Özetle, TrendHeikinMultiMA trend değişikliğini (yükseliş veya düşüş) yalnızca Heikin-Ashi'den hesaplanan ve seçilen hareketli ortalama ile işlenen yumuşatılmış açılış ve kapanış değerleri tutarlı şekilde piyasa davranışının yön değiştirdiğini gösterdiğinde onaylar.
Bu, sinyallerin daha güvenilir ve geleneksel mum grafiklerinde görülen gürültüden daha az etkilenmesini sağlar. 🚀📊
🔥 Pinescritlabs Ctrader Store göstergeleri 🔥
Dynamic Market Structure
Dönüş Noktalarının Analizi
Fibonacci Linear
Regresyon Çok Zamanlı Çerçeve
Multi-Level Candle Bias
Tracker
Auto Support and
Resistance Trend Lines
All Support and
Resistance Levels
Özet
The indicator incorporates a smoothing mechanism that delays color changes to confirm trend reversals only after a significant and sustained difference between smoothed open and close values is detected. This approach reduces false signals caused by brief price fluctuations crossing trend lines.
Users can select from multiple moving average types, each applying distinct mathematical weighting methods to the Heikin-Ashi-derived open, close, high, and low values, enhancing customization and adaptability to different trading styles.
Compared to traditional candlestick charts, Trend Heikin Multi MA filters out minor price fluctuations and abrupt swings, allowing traders to focus on primary market trends with more reliable signals. It confirms bullish or bearish trend changes only when smoothed values consistently indicate a market direction reversal, improving signal accuracy and reducing noise.
Müşteri değerlendirmeleri
5 | 33 % | |
4 | 67 % | |
3 | 0 % | |
2 | 0 % | |
1 | 0 % |


!["[CB] Pivot Points Pro" logosu](https://cdn.ctrader.com/image/webp/43463c82-67b0-4f10-a4ba-901bba091d81_32594)


