
Institutional Flow Radar
インジケーター
3 購入済
バージョン 1.0、Nov 2025
Windows、Mac
4.3
レビュー: 3
説明
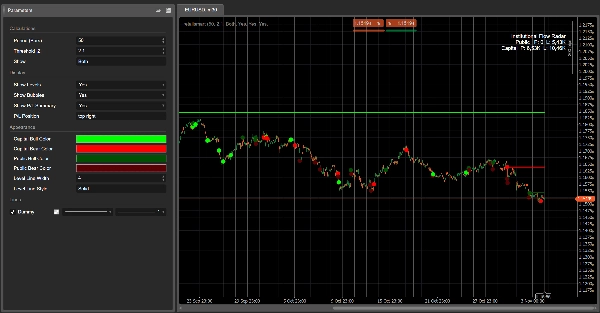
インスティテューショナルフロー・レーダー – 説明
コンセプト:
インスティテューショナルフロー・レーダーはチャートをスキャンし、異常な出来高イベントを検出し、2つのグループに分類します:
- キャピタル → より強力で情報に基づいた参加者による活動
- パブリック → より広範な群衆による活動
その後:
- それらのイベントに水平ラインを引き、
- 最も関連性の高いイベントをカラフルなバブルでマークし、
- そして損益の概要を表示し、キャピタルとパブリックの出来高が現在どれだけ利益または損失になっているかを比較します。
一目で、どこで大きな出来高がテープに現れたか、誰が勝っているか、そしてどの価格がまだ維持されているかがわかります。
仕組み(簡略版)
- 各バーについて、アルゴリズムは過去Nバー(期間)にわたる出来高のZスコアを計算します。
- 絶対値のZスコアが設定した閾値 |Z|を超える場合、そのバーは出来高イベントとしてタグ付けされます。
- ローソク足の構造(実体と全範囲の比率)を使ってイベントを分類します:
-
- 小さな実体、長いヒゲ → キャピタル(吸収/より複雑な挙動)
- 大きな実体、方向性のある動き → パブリック(群衆スタイルのブレイクアウト/追随)
- イベント価格に水平ラインを引き、そのレベルを価格が明確に突破するまで保持します(緩和)。
- 各アクティブレベルについて、レーダーは現在の価格が以下のどちらかをチェックします:
-
- 利益圏内(価格がイベントの方向に動いた場合)、または
- 損失圏内(価格が逆方向に動いた場合)。
- 損益概要ボックスはすべてのアクティブレベルの出来高を集計します:
-
- キャピタルの利益対損失
- パブリックの利益対損失
視覚要素
- キャピタルレベル:
-
- 上昇イベント → 強気のキャピタルレベル(例:明るい緑/アクア)
- 下降イベント → 弱気のキャピタルレベル(例:明るい赤)
- パブリックレベル:
-
- 上昇イベント → 強気のパブリックレベル(灰色がかった色調)
- 下降イベント → 弱気のパブリックレベル(より暗い灰色/チャコール)
- バブル:
-
- 最も重要なイベントに円を描き、以下で色分け:
-
- 方向(強気/弱気)
- クラス(キャピタル/パブリック)
- 損益概要ボックス:
-
- 行: パブリック、キャピタル
- 列: 利益、損失
- セルの背景の濃さは対応する出来高に応じて増加します。
推奨パラメータラベル(英語)
- 期間(バー数): 出来高Zスコアを計算するために使用されるバーの数。
- 閾値 |Z|: イベントをマークするための最小絶対Zスコア。
- 表示:
Capital、Public、またはBoth– 表示するクラス。 - レベル表示 / バブル表示 / 損益概要表示
- キャピタル強気色 / キャピタル弱気色
- パブリック強気色 / パブリック弱気色
- 平均線の太さ / 平均線のスタイル
概要
AIによる概要
Institutional Flow Radar is a trading indicator that identifies and classifies abnormal volume events on price charts into two categories: Capital (activity from stronger or more informed participants) and Public (activity from the broader crowd). It calculates a volume Z-score for each bar over a specified period and flags bars exceeding a set threshold as volume events. These events are further classified based on candle structure—smaller bodies with long wicks indicate Capital activity, while larger bodies with directional moves indicate Public activity.
The indicator visually marks these events by drawing horizontal levels at event prices, which remain until price moves decisively through them. Significant events are highlighted with colored bubbles indicating direction (bullish or bearish) and classification (Capital or Public). A P/L summary box aggregates volume at active levels, showing Capital and Public volumes currently in profit or loss.
Users can customize parameters such as the period for Z-score calculation, threshold for event detection, and visual settings including colors for bullish and bearish levels for both Capital and Public groups. This tool provides a consolidated view of where large volume occurred, which participant group is prevailing, and which price levels are holding, aiding in volume-based breakout analysis.
インジケーターのプロフィール
カスタマーレビュー
4.3
レビュー: 3
5 | 33 % | |
4 | 67 % | |
3 | 0 % | |
2 | 0 % | |
1 | 0 % |
カスタマーレビュー
November 18, 2025
The only reason it stays interesting is the trading notes stop feeling so random, and two sessions say more than one clean chart.
November 9, 2025
ディスカッション
よくあるご質問
Breakout
cTrader Storeで入手可能な取引ボット、インジケーター、プラグインなどの商品は、第三者の開発者が提供するものであり、情報と技術の取得のみを目的としてご利用いただけます。cTrader Storeはブローカーではなく、投資助言や個人的な推奨を行うことも、将来のパフォーマンスを保証することもありません。


価格
42.11M
取引数量
6.13M
獲得pips
222
販売
8.39K
無料インストール