Açıklama
Hacim Baloncukları – cTrader Özel Göstergesi
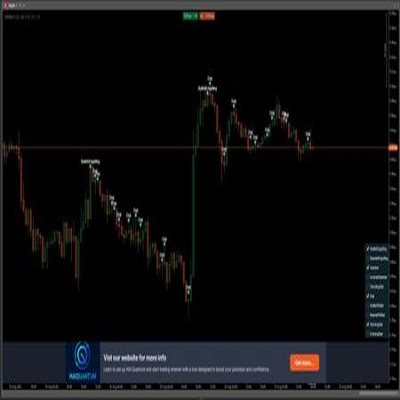
Hacim Baloncukları, mumları olağanüstü hacim ile doğrudan fiyat grafiğinde vurgulayan, hafif ama güçlü bir cTrader görsel göstergesidir.
Hacim histogramına bakıp hangi çubukların gerçekten önemli olduğunu tahmin etmeye çalışmak yerine, bu araç mevcut mumun hacmi son ortalamanın önemli ölçüde üzerindeyse otomatik olarak algılar ve o çubuğun üzerine bir baloncuk (daire simgesi) çizer:
- Boğa mumları için, baloncuk mumun düşük seviyesinin altında çizilir.
- Ayı mumları için, baloncuk mumun yüksek seviyesinin üstünde çizilir.
Bu, potansiyel zirve hareketlerini, büyük oyuncuların güçlü ilgi alanlarını veya trendde olası tükenme noktalarını tespit etmeyi son derece kolaylaştırır.
Ana Özellikler
- ✅ Hareketli Ortalama kullanarak yüksek hacimli mumları algılar
- ✅ Grafikte net baloncuklar çizer (ek alt pencere gerekmez)
- ✅ Boğa ve ayı hacim artışları için farklı renkler
- ✅ Baloncukları mumdan uzaklaştırmak için ayarlanabilir pip ofseti
- ✅ Baloncukları sadece en son çubukta göstermek için seçenek (gerçek zamanlı işlem için)
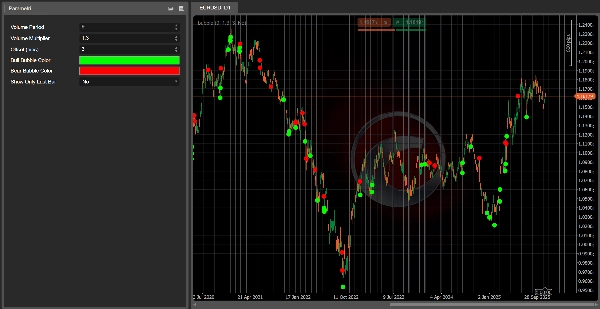
Girdi / Parametreler
- Hacim Periyodu – Hacim hareketli ortalaması için kullanılan çubuk sayısı.
- Hacim Çarpanı – Baloncuk tetiklemek için bir çubuğun ortalama hacmin kaç katı olması gerektiği.
- Ofset (pip) – Baloncuk ile mumun yüksek/düşük seviyesi arasındaki mesafe.
- Boğa Baloncuğu Rengi – Boğa mumlarındaki baloncukların rengi.
- Ayı Baloncuğu Rengi – Ayı mumlarındaki baloncukların rengi.
- Sadece Son Çubuğu Göster – Doğruysa, baloncukları sadece mevcut canlı çubukta gösterir.
Nasıl Kullanılır
Grafiğinize Hacim Baloncukları ekleyin ve görsel bir filtre olarak kullanın:
- Güçlü hacimle desteklenen kırılmaları onaylamak için
- Olası dönüşleri veya tükenme mumlarını tespit etmek için
- Büyük oyuncuların aktif olabileceği bölgeleri belirlemek için
Bu bağımsız bir işlem sistemi değildir, ancak hacme önem veren herhangi bir fiyat hareketi veya trend takip stratejisi için mükemmel bir yardımcı araçtır.
👉 Buraya katılın: Algotrendit Hacim Baloncukları
Sunucu içinde bulacaksınız:
- Bu ve diğer cBotlar/göstergeler için destek
- Strateji tartışmaları ve optimizasyon fikirleri
- Yayınladığım güncellemeler, haberler ve gelecekteki araçlar
Özet
Key features include adjustable parameters such as the volume period for averaging, volume multiplier threshold, bubble offset in pips, and customizable colors for bullish and bearish volume spikes. Users can also choose to display bubbles only on the latest bar for real-time trading. The indicator integrates directly on the price chart without requiring additional subwindows.
Volume Bubbles serves as a visual filter to confirm breakouts supported by strong volume, spot possible reversals or exhaustion candles, and identify zones of significant market activity. It complements price action and trend-following strategies by providing volume-based insights across various markets including forex, indices, commodities, stocks, and cryptocurrencies.
Müşteri değerlendirmeleri
5 | 0 % | |
4 | 100 % | |
3 | 0 % | |
2 | 0 % | |
1 | 0 % |