
Breakout channel
Gösterge
525 i̇ndirmeler
Sürüm 1.0, Nov 2025
Windows, Mac
Açıklama
Breakout Kanalları
Ne yapar
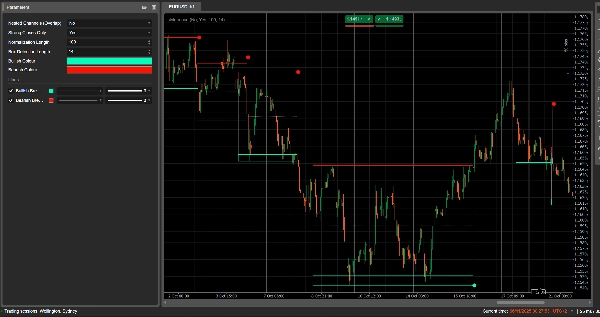
Breakout Kanalları otomatik olarak konsolidasyon aralıklarını (fiyat “kutuları”) algılar ve fiyat bu aralıklardan çıktığında breakout noktalarını işaretler.
Şunları çizer:
- Konsolidasyon bölgesinin etrafında gri bir kanal kutusu
- Potansiyel direnç olan kırmızı üst bant
- Potansiyel destek olan yeşil alt bant
- Kanalın orta noktası olan beyaz noktalı orta çizgi
- Breakout gerçekleştiğinde renkli noktalar.
-
- Kutunun altında yeşil/cyan nokta → boğa breakout'u
- Kutunun üstünde kırmızı nokta → ayı breakout'u
Fikir, fiyatın sıkıştığı ve aralık kırıldığında güçlü hareketlerin başlamasının muhtemel olduğu alanları görsel olarak vurgulamaktır.
Nasıl hesaplanır
- Fiyat normalizasyonu
-
- Son Normalization Length çubukta en yüksek yüksek ve en düşük düşük bulunur.
- Kapanış 0–1 aralığına normalize edilir:
normalizedPrice=Close−LowestLowHighestHigh−LowestLow\text{normalizedPrice} = \frac{\text{Close} - \text{LowestLow}}{\text{HighestHigh} - \text{LowestLow}}normalizedPrice=HighestHigh−LowestLowClose−LowestLow
- Volatilite ölçüsü
-
- Normalleştirilmiş fiyatın 14 çubuk üzerindeki standart sapması hesaplanır.
- Bu, piyasa yapısındaki dönüş noktalarını tespit etmek için kullanılan bir volatilite serisi sağlar.
- Üst / Alt “volatilite çizgileri”
-
- Son (Box Detection Length + 1) çubukta şunlar bulunur:
-
- Volatilitenin en yüksek olduğu çubuk
- Volatilitenin en düşük olduğu çubuk
- Bu aşırı değerlerin kaç çubuk önce gerçekleştiğine göre iki sentetik çizgi oluşturulur: Üst ve Alt.
- Bu çizgiler arasındaki kesişmeler kanal fazının potansiyel başlangıç/bitişini işaret eder.
- Kanal başlangıcı ve süresi
-
- Alt, Üst'ün üzerine çıktığında, gösterge potansiyel kanal başlangıcını işaretler.
- O çubuktan itibaren dönemi boyunca süreyi ve en yüksek yüksek / en düşük düşük takip eder.
- Kanal oluşturma
-
- Daha sonra Üst, Alt'ın üzerine çıktığında ve süre 10 çubuktan büyükse:
-
- Kanalın Üstü o dönemdeki en yüksek yüksek olarak tanımlanır.
- Kanalın Altı en düşük düşük olarak tanımlanır.
- Üst ve alt bölgede ince bir alan ayırmak için mevcut ATR/2 ölçülür:
-
- Kırmızı bant üstte (ayı bantı)
- Yeşil bant altta (boğa bantı)
- Şunları çizer:
-
- Gri çerçeve dikdörtgeni (tam kanal)
- Kırmızı üst çerçeve
- Yeşil alt çerçeve
- Ortadan geçen beyaz noktalı orta çizgi
- Kanallar, breakout sonrası silinmez ve grafik üzerinde tarihsel yapı olarak kalır.
- Breakout tespiti
-
- Her aktif kanal için, her yeni çubukta bir referans fiyat hesaplanır:
-
- Eğer Strong Closes Only = true ise, mum gövdesinin orta noktası kullanılır:
refPrice=(Open+Close)/2\text{refPrice} = (\text{Open} + \text{Close})/2refPrice=(Open+Close)/2
Bu, gövdenin yarısından fazlasının kutunun dışında olmasını gerektirir. - Eğer Strong Closes Only = false ise, basit kapanış kullanılır.
- Eğer Strong Closes Only = true ise, mum gövdesinin orta noktası kullanılır:
- Breakout kuralları:
-
- Eğer
refPrice > Topise → boğa breakout'u -
- Kanalın Altında yeşil bir nokta çizer.
- Bu kanalı devre dışı bırakır (uzatmayı durdurur), ancak kutu görünür kalır.
- Eğer
refPrice < Bottomise → ayı breakout'u -
- Kanalın Üstünde kırmızı bir nokta çizer.
- Kanali devre dışı bırakır.
- Aksi takdirde, kanal hala aktiftir ve sağ kenarı mevcut çubuğa kadar uzatılır.
- Eğer
- İç içe Kanallar seçeneği
-
- Eğer Nested Channels = true ise, birden fazla kanal zaman ve fiyat açısından üst üste binebilir.
- Eğer false ise, gösterge mevcut bir kanal ile çakışacak yeni kanal oluşturulmasını engeller.
Nasıl okunur ve kullanılır
- Gri kutu (kanal)
-
- Fiyatın bir süre işlem gördüğü konsolidasyon / denge bölgesini temsil eder.
- Kutu ne kadar uzun ve yüksekse, aralık o kadar anlamlıdır.
- Kırmızı üst bant (direnç bölgesi)
-
- Kanalın üst kısmı, görsel olarak potansiyel direnç alanı olarak vurgulanır.
- Bu banda yakın tekrarlanan reddedilmeler, aralık içinde satış baskısını gösterir.
- Yeşil alt bant (destek bölgesi)
-
- Kanalın alt kısmı, potansiyel destek olarak vurgulanır.
- Tekrarlanan sıçramalar, alıcıların aralığın alt sınırını savunduğunu gösterir.
- Beyaz noktalı orta çizgi
-
- Kanalın orta noktası – yerel bir “adil değer” türü.
- Fiyatın bu çizgi etrafında dalgalanması dengeyi gösterir; güçlü hareketler genellikle karşı bantın testinden önce gelir.
- Breakout noktaları
-
- Kutunun altında yeşil nokta:
-
- Fiyat kanalın üstünün üzerinde güçlü bir şekilde kapanmıştır (veya sadece üstünde kapanmıştır, Strong Closes Only ayarına bağlı olarak).
- Bu, volatilite sıkışmasından bir yukarı hareketin potansiyel başlangıcını gösterir – boğa breakout'u.
- Kutunun üstünde kırmızı nokta:
-
- Fiyat kanalın altının altında güçlü bir şekilde kapanmıştır.
- Bu, aşağı yönlü bir hareketin potansiyel başlangıcını gösterir – ayı breakout'u.
- Tipik kullanım şekilleri (fikir düzeyi)
-
- Trend takip eden breakoutlar
-
- Breakout yönünde işlem yapın (yeşil noktadan sonra al, kırmızı noktadan sonra sat), tercihen daha yüksek zaman dilimi trendi veya diğer göstergelerle uyumlu olarak.
- Filtre ve onay
-
- Kanal ve breakout'u mevcut stratejiniz için sadece bir filtre olarak kullanın (örneğin, sadece son sinyal boğa breakout'u ise uzun pozisyon alın).
- Risk yerleştirme
-
- Boğa breakoutlarında, birçok trader stopları eski kanalın içinde veya hemen altında; ayı breakoutlarında ise kutunun içinde veya üstünde yerleştirir.
Özet
YZ özeti
Breakout Channels is a technical indicator designed to identify consolidation zones and signal potential price breakouts. It automatically detects price ranges where the market is coiling, marking these with a grey channel box that highlights the consolidation area. The indicator draws a red upper band indicating potential resistance, a green lower band indicating potential support, and a white dotted midline representing the channel midpoint or local fair value.
Breakout points are signaled by colored dots: a green or cyan dot below the box indicates a bullish breakout, while a red dot above signals a bearish breakout. The indicator calculates these zones by normalizing price data, measuring volatility through the standard deviation of normalized prices, and identifying volatility extremes to define channel start and duration.
Channels remain visible on the chart as historical structures even after breakouts. Users can enable nested channels to allow overlapping consolidation zones. Breakout detection uses either candle body midpoints or close prices, depending on settings, to confirm strong closes outside the channel.
Typical uses include trading in the breakout direction, filtering existing strategies, and placing risk stops near channel boundaries. The indicator supports various markets including forex, indices, commodities, stocks, and cryptocurrencies.
Gösterge profili
Müşteri değerlendirmeleri
0.0
Değerlendirmeler: 0
Müşteri değerlendirmeleri
Bu ürün için henüz bir değerlendirme yok. Ürünü denediniz mi? O zaman ona dair görüşlerini paylaşan ilk kişi olun!
Tartışma
SSS
Signal
Indices
Commodities
GBPUSD
RSI
Bollinger
Fibonacci
Scalping
AI
XAUUSD
NAS100
MACD
BTCUSD
Forex
Breakout
EURUSD
NZDUSD
Martingale
Prop
ZigZag
Supertrend
Fair Value Gap
SMC
Crypto
Grid
Stocks
ATR
USDJPY
VWAP
cTrader Store üzerinden erişilebilen işlem botları, göstergeler ve eklentiler gibi ürünler, üçüncü taraf sağlayıcılar tarafından sağlanır ve yalnızca bilgilendirme ve teknik erişim amaçlarıyla sunulur. cTrader Store bir broker değildir ve yatırım tavsiyesi, kişisel öneriler vermez veya gelecekteki performansı garanti etmez.


Fiyat
42.11M
İşlem hacmi
6.13M
Kazanılan pip
230
Satışlar
8.52K
Ücretsiz yüklemeler