
Açıklama
https://chartshots.spotware.com/c/695be69b1a3ca
https://chartshots.spotware.com/c/695be2a98e848
https://chartshots.spotware.com/c/695be7e8e88fa
https://chartshots.spotware.com/c/695be31346fe7
https://chartshots.spotware.com/c/695be3bd18aea
https://chartshots.spotware.com/c/695be5d5687c7
Otomatik Grafik Formasyonları
📊 NEDİR?
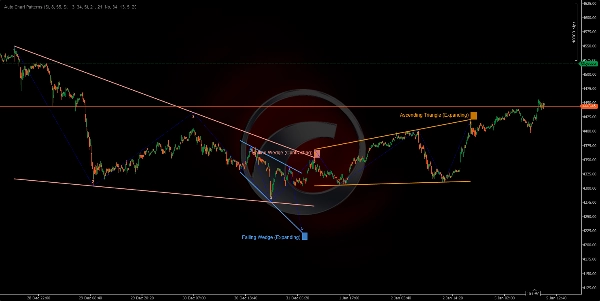
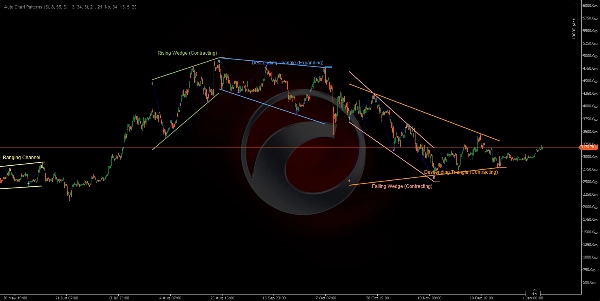
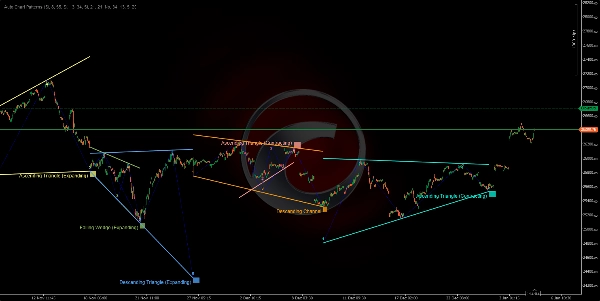
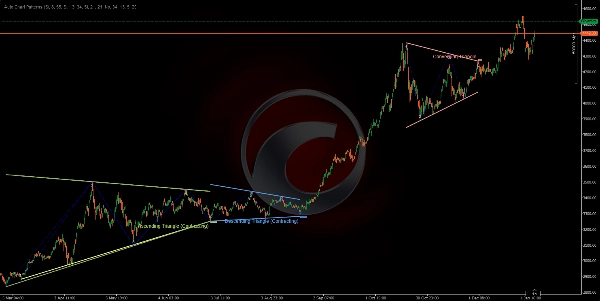
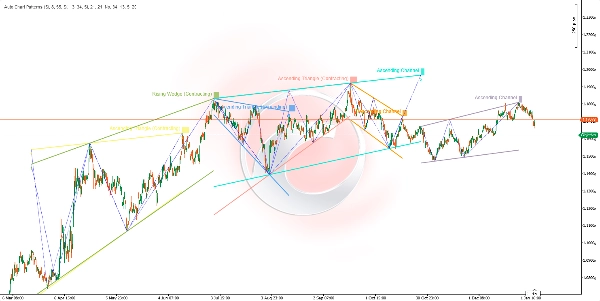
Otomatik Grafik Formasyonları göstergesi, çoklu zaman dilimi salınım noktası analizi kullanarak klasik grafik formasyonlarını otomatik olarak algılayan ve görselleştiren gelişmiş bir geometrik formasyon tarayıcısıdır. Salınım yüksekleri ve düşüklerini trend çizgileriyle birleştirerek kanallar, kama ve üçgenler dahil olmak üzere 14 farklı geometrik formasyonu tanımlar ve kapsamlı bir formasyon tanıma sistemi oluşturur.
🎯 NE İÇİN KULLANILIR?
Bu gösterge, yatırımcılara şunlarda yardımcı olur:
- Otomatik olarak 14 klasik grafik formasyonunu (kanallar, kamalar, üçgenler) 📐
- Olası kırılma bölgelerini belirlemek önceden ⚡
- Geometrik fiyat ilişkileri aracılığıyla piyasa yapısını görselleştirmek 🔍
- Görsel onay ile devam ve dönüş formasyonlarıyla işlem yapmak ✅
- Formasyonları trend yönü ve son pivot türüne göre filtrelemek 🎛️
- Çoklu salınım zaman dilimlerini aynı anda analiz etmek ve örtüşmeleri değerlendirmek 🌊
🔍 NASIL ÇALIŞIR?
Salınım Noktası Algılama Sistemi 📍
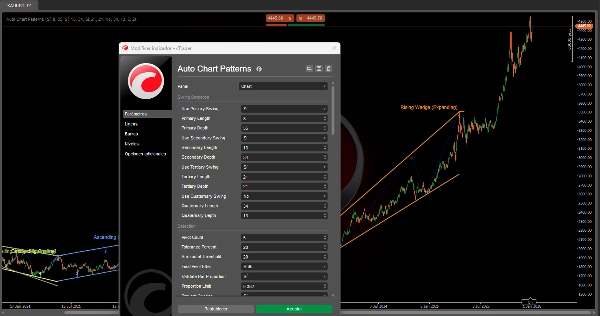
Gösterge, yapılandırılabilir hassasiyete sahip dört bağımsız salınım detektörünü aynı anda çalıştırır:
- Algılama Mantığı:
-
- Fiyatın yüksek ve düşüklerini hareketli bir pencere (Periyot) boyunca izler.
- Yerel zirveleri (salınım yüksekleri) ve dipleri (salınım düşükleri) tanımlar.
- Minimum derinlik şartı karşılandıktan sonra salınımları onaylar (gürültüyü önler).
- Salınım Yüksekliği: Fiyat, Periyot içinde en yüksek yüksekliği yapar, ardından
MinDepthbar boyunca düşer. - Salınım Düşüklüğü: Fiyat, Periyot içinde en düşük düşüğü yapar, ardından
MinDepthbar boyunca yükselir.
- Dört Salınım Katmanı:
-
- Birincil Salınım (Varsayılan: Uzunluk 8, Derinlik 55) - Uzun vadeli yapı 🔵
- İkincil Salınım (Varsayılan: Uzunluk 13, Derinlik 34) - Orta vadeli yapı 🟢
- Üçüncül Salınım (Varsayılan: Uzunluk 21, Derinlik 21) - Kısa vadeli yapı 🟡
- Dördüncül Salınım (Varsayılan: Devre Dışı) - Özel zaman dilimi 🟣
Her detektör, belirli piyasa yapılarına odaklanmak için bağımsız olarak etkinleştirilebilir/devre dışı bırakılabilir.
Formasyon Oluşum Süreci 🎨
ADIM 1 - PİVOT TOPLAMA:
- Sistem, herhangi bir aktif detektörden en son 5 veya 6 salınım noktasını toplar.
- Noktalar yüksekler ve düşükler arasında dönüşümlü olmalıdır (zigzag yapısı).
- Örnek 5 nokta: Yüksek → Düşük → Yüksek → Düşük → Yüksek.
ADIM 2 - TREND ÇİZGİSİ İNŞASI:
- Pivotları üst noktalar (salınım yüksekleri) ve alt noktalar (salınım düşükleri) olarak ayırır.
- İki trend çizgisi çizer: üst sınır ve alt sınır.
- 3 noktalı sınırlar için: 3 kombinasyonu test eder (0-2, 0-1, 1-2) ve en iyi uyumu seçer ⭐
- Trend çizgilerinin mum gövdelerine girmediğini doğrular (yalnızca fitiller izinlidir).
- Bir uyum puanı hesaplar: çizgiler pivotlar arasındaki barların %20'sinden azına dokunmalıdır.
ADIM 3 - GEOMETRİK ANALİZ:
- Üst ve alt sınırlar arasındaki açı ilişkisini ölçer.
- Formasyonun Genişleyen (genişleyen), Daralan (daralan) veya Paralel (sabit genişlik) olup olmadığını belirler.
- Trend yönünü tanımlar: Yukarı, Aşağı veya Nötr (yatay).
- Geometriye göre 14 formasyon tipinden birine sınıflandırır.
ADIM 4 - DOĞRULAMA & FİLTRELEME:
- Bar Oranı Kontrolü: Salınım aralığının orantılı olmasını sağlar (bozuk formasyonları önler) ✅
- Çakışma Önleme: Mevcut formasyonlarla çakışan yeni formasyonları engeller 🚫
- Çoğaltma Kontrolü: Aynı formasyonun tekrar çizilmesini önler.
- Son Pivot Filtresi: Sadece belirtilen pivot yönüyle (Yukarı/Aşağı/Her İkisi) biten formasyonları gösterir.
- Formasyon Tipi Filtresi: Belirli formasyon kategorilerini etkinleştirir/devre dışı bırakır.
ADIM 5 - GÖRSELLEŞTİRME:
- 12 renkli paletten canlı renklerle üst ve alt sınır çizgilerini çizer 🎨
- İsteğe bağlı olarak pivotları bağlayan zigzag salınım çizgilerini gösterir (noktalı mavi).
- Her salınım noktasında pivot numaralarını (1, 2, 3, 4, 5) gösterir.
- Formasyonu, son pivotta formasyon adıyla etiketler.
- Etiketin arkasındaki arka planı netlik için renklendirir.
📐 ALGILANAN 14 FORMASYON
KANALLAR (Paralel Formasyonlar) 📦
- Yükselen Kanal (Yukarı Paralel) 📈
-
- Her iki sınır benzer bir açıyla yukarı eğimlidir.
- Boğa devam trendini gösterir.
- İşlem: Alt sınırdan al, üst sınırdan sat.
- Düşen Kanal (Aşağı Paralel) 📉
-
- Her iki sınır benzer bir açıyla aşağı eğimlidir.
- Ayı devam trendini gösterir.
- İşlem: Üst sınırdan sat, alt sınırdan al.
- Yatay Kanal (Yanal/Yatay) ↔️
-
- Her iki sınır neredeyse yataydır.
- Konsolidasyon veya kararsızlık gösterir.
- İşlem: Aralıkta işlem stratejisi, destekten al/dirençten sat.
GENİŞLEYEN KAMALAR (Genişleyen Formasyonlar) 📣
4. Yükselen Kama (Genişleyen) ⚠️
* Her iki sınır yukarı eğimlidir ve aralarındaki boşluk genişlemektedir.
* Ayı dönüş formasyonu - fiyat yukarı momentumunu kaybediyor.
* İşlem: Alt sınır kırılmasını bekle, kısa pozisyona gir.
5. Düşen Kama (Genişleyen) ⚠️
* Her iki sınır aşağı eğimlidir ve aralarındaki boşluk genişlemektedir.
* Boğa dönüş formasyonu - fiyat aşağı momentumunu kaybediyor.
* İşlem: Üst sınır kırılmasını bekle, uzun pozisyona gir.
6. Ayrışan Üçgen (Genişleyen Üçgen) 🔺
* Üst sınır yukarı eğimli, alt sınır aşağı eğimli.
* Yüksek volatilite genişleme formasyonu.
* İşlem: Çok riskli, net bir yön kırılmasını bekle.
7. Yükselen Üçgen (Genişleyen) 📊
* Üst sınır yatay, alt sınır yukarı eğimli.
* Genişleyen aralık ile boğa devamı.
* İşlem: Üst sınır kırılmasından al.
8. Düşen Üçgen (Genişleyen) 📊
* Alt sınır yatay, üst sınır aşağı eğimli.
* Genişleyen aralık ile ayı devamı.
* İşlem: Alt sınır kırılmasından sat.
DARALAN KAMALAR (Yakınsayan Formasyonlar) 🔻
9. Yükselen Kama (Daralan) 🔺
* Her iki sınır yukarı eğimlidir ve aralarındaki boşluk daralmaktadır.
* Ayı dönüş formasyonu - boğa tükenişi ⚠️
* İşlem: Alt sınır kırılmasında kısa pozisyona gir.
10. Düşen Kama (Daralan) 🔻
* Her iki sınır aşağı eğimlidir ve aralarındaki boşluk daralmaktadır.
* Boğa dönüş formasyonu - ayı tükenişi ⚠️
* İşlem: Üst sınır kırılmasında uzun pozisyona gir.
DARALAN ÜÇGENLER (Konsolidasyon Formasyonları) △
11. Yakınsayan Üçgen (Simetrik Üçgen) ⚖️
* Üst sınır aşağı eğimli, alt sınır benzer oranda yukarı eğimli.
* Nötr konsolidasyon - devam formasyonu.
* İşlem: Kırılma yönünü bekle, ona göre işlem yap.
12. Düşen Üçgen (Daralan) 📐
* Alt sınır yatay (destek), üst sınır aşağı eğimli.
* Ayı devam formasyonu 🔴
* İşlem: Hacimle destek kırılmasında kısa pozisyona gir.
13. Yükselen Üçgen (Daralan) 📐
* Üst sınır yatay (direnç), alt sınır yukarı eğimli.
* Boğa devam formasyonu 🟢
* İşlem: Hacimle direnç kırılmasında uzun pozisyona gir.
14. Geçersiz/Bilinmeyen ❌
* Geometrik kriterleri karşılamayan formasyonlar.
* Otomatik olarak filtrelenir.
Özet
Key functionalities include identifying potential breakout zones, visualizing market structure through geometric price relationships, and supporting trading of continuation and reversal patterns with visual confirmation. Users can filter detected patterns by trend direction, pivot type, and formation category. The indicator prevents overlapping and duplicate patterns to maintain clarity.
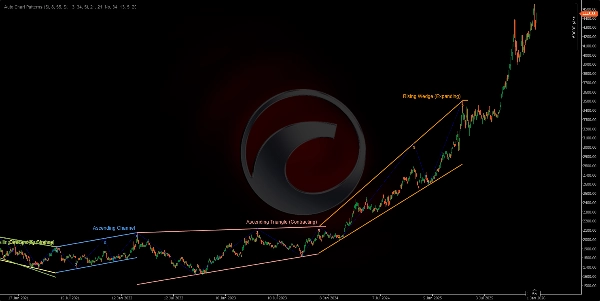
The 14 detected formations cover a range of classical patterns such as ascending, descending, and ranging channels; expanding and contracting wedges; and various triangle types (converging, diverging, ascending, descending). Visual outputs include color-coded boundary lines, pivot numbering, zigzag swing lines, and labeled pattern names for easy interpretation. This tool supports analysis across multiple markets including Forex, stocks, commodities, indices, and cryptocurrencies.
Müşteri değerlendirmeleri
5 | 50 % | |
4 | 50 % | |
3 | 0 % | |
2 | 0 % | |
1 | 0 % |


