
Açıklama
Oturum Hacim Profili HD
Ne Yapar
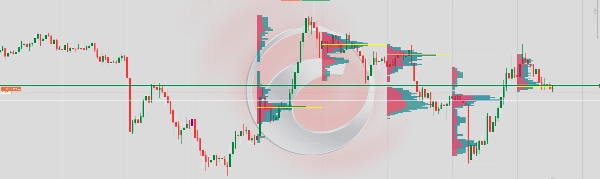
Her işlem oturumu için yatay bir hacim profili doğrudan grafikte gösterir. İşlem hacminin fiyat seviyeleri arasında nasıl dağıldığını gösterir, bu da tüccarların yüksek aktivite bölgelerini, adil değer alanlarını ve tamamen hacim davranışından türetilen önemli destek/direnç seviyelerini belirlemelerine yardımcı olur.
Nasıl Çalışır
Her yeni bar kapanışında, gösterge tanımlı oturum sayısı içindeki tüm barları tarar ve her barın tick hacmini fiyat aralığına dağıtır. Hacim, barın açılış/kapanış yönü bir vekil olarak kullanılarak alış tarafı (boğa barları) ve satış tarafı (ayı barları) olarak ayrılır. Sonuç, oturumun zaman sınırına sabitlenmiş katmanlı yatay bir histogram olarak çizilir.
Görsel Öğeler
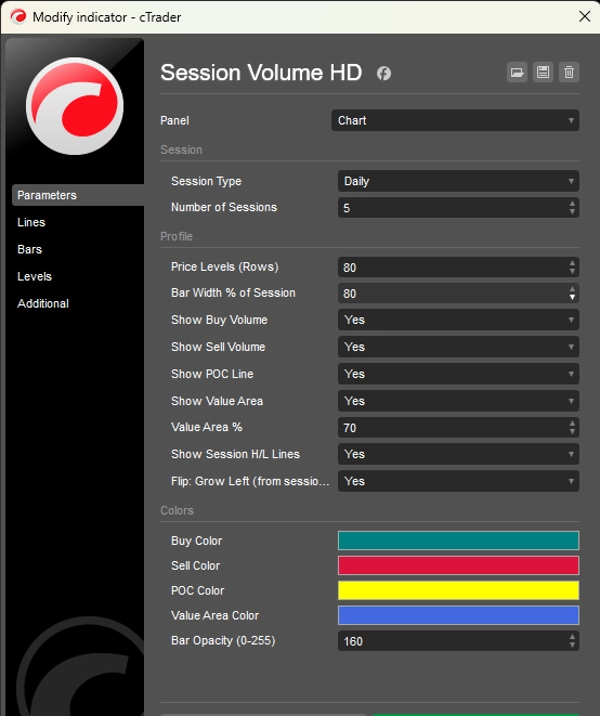
Alış Barları (Turkuaz) — Her seviyede boğa fiyat hareketinde işlem gören hacmi gösterir. Oturum sabit noktasından sola doğru (veya ters çevrilmişse sağa doğru) büyür.
Satış Barları (Kırmızı) — Her seviyede ayı fiyat hareketinde işlem gören hacmi gösterir, alış barlarının yanında yığılır.
POC Çizgisi (Sarı) — Kontrol Noktası. Oturumdaki en yüksek toplam hacme sahip fiyat seviyesini işaret eden yatay çizgi. Fiyat için bir mıknatıs görevi görür.
Değer Alanı (Mavi örtü) — Oturumun toplam hacminin yapılandırılabilir bir yüzdesini (varsayılan %70) içeren fiyat aralığı. Çoğu işlemin gerçekleştiği "adil değer" bölgesini temsil eder.
Oturum Yüksek/Düşük Çizgileri (Beyaz noktalı) — Oturum sırasında ulaşılan en yüksek ve en düşük fiyatları işaretler.
Performans
Gösterge her yeni bar için yalnızca bir kez yeniden çizilir, her tickte değil. Bu, titremeyi ortadan kaldırır ve çok sayıda oturum ve yüksek fiyat seviyesi sayısı ile bile stabil çizim sağlar.
Sınırlamalar
cTrader, tick veri akışı olmadan bar seviyesinde gerçek bid/ask hacmini açığa çıkarmadığı için, alış/satış hacmi bar yönü kullanılarak yaklaşık olarak hesaplanır: boğa barları %65 alış / %35 satış, ayı barları ters oranla, doji barları ise %50/%50 olarak bölünür. Gerçek delta hacmi için tick veri aboneliği gereklidir.


