
Footprint Chart_noSourceCode
Gösterge
1 satın almalar
Sürüm 1.0, Sep 2025
Windows, Mac
4.3
Değerlendirmeler: 3
Açıklama
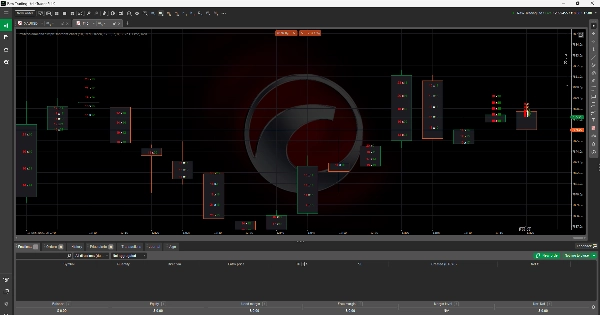
footprint Chart Indicator
Footprint Grafik Göstergesi, tüccarlara her fiyat mumunun içinde teklif ve talep hacmini doğrudan göstererek emir akışının ayrıntılı bir görünümünü sunar. Geleneksel mum grafiklerinin aksine, bu araç kullanıcıların belirli fiyat seviyelerinde alım ve satım baskısının nerede yoğunlaştığını görmelerini sağlar. Alıcılar ve satıcılar arasındaki dengesizlikleri vurgulayarak piyasa derinliği, likidite ve işlem aktivitesi hakkında daha derin içgörüler sunar. Bu, gelişmiş emir akışı analizi yoluyla girişleri, çıkışları ve risk yönetimini iyileştirmeyi amaçlayan tüccarlar için vazgeçilmez bir araçtır.
Özet
YZ özeti
The Footprint Chart Indicator enhances traditional candlestick charts by displaying bid and ask volumes within each price candle. This visualization allows traders to observe buying and selling pressure at specific price levels, revealing imbalances between buyers and sellers. By providing detailed insights into order flow, market depth, liquidity, and trading activity, the indicator supports more precise trade entries, exits, and risk management decisions. It is applicable across various markets including Forex, cryptocurrencies (e.g., BTCUSD), commodities, indices, and stocks. The tool is designed for traders who utilize advanced order flow analysis to refine their strategies.
Gösterge profili
Müşteri değerlendirmeleri
4.3
Değerlendirmeler: 3
5 | 67 % | |
4 | 0 % | |
3 | 33 % | |
2 | 0 % | |
1 | 0 % |
Müşteri değerlendirmeleri
September 29, 2025
This fits volume based context better as a review layer. The first forward check can be 97 setups on M1, with 20 reactions and manual notes.
September 26, 2025
More useful for someone who wants less noise in the process. The best use is checking participation and pressure, then leaving the final filter manual.
September 23, 2025
I liked it more as a confirmation layer for volume based context than as something to follow blindly. Pressure is easier to read, and the final decision still feels like it belongs to the trader. Light sizing makes the early sample easier to judge.
Tartışma
SSS
BTCUSD
Forex
Signal
Indices
EURUSD
Commodities
GBPUSD
NZDUSD
Prop
Scalping
Crypto
Stocks
XAUUSD
NAS100
USDJPY
cTrader Store üzerinden erişilebilen işlem botları, göstergeler ve eklentiler gibi ürünler, üçüncü taraf sağlayıcılar tarafından sağlanır ve yalnızca bilgilendirme ve teknik erişim amaçlarıyla sunulur. cTrader Store bir broker değildir ve yatırım tavsiyesi, kişisel öneriler vermez veya gelecekteki performansı garanti etmez.
Bu oluşturanın diğer ürünleri


Fiyat
Başlangıç 15/01/2025
7
Satışlar