

Money Flow Profile
Gösterge
Sürüm 1.0, Jul 2026
Windows, Mac

534.4M
İşlem hacmi
9.76M
Kazanılan pip
4
Satışlar
Açıklama
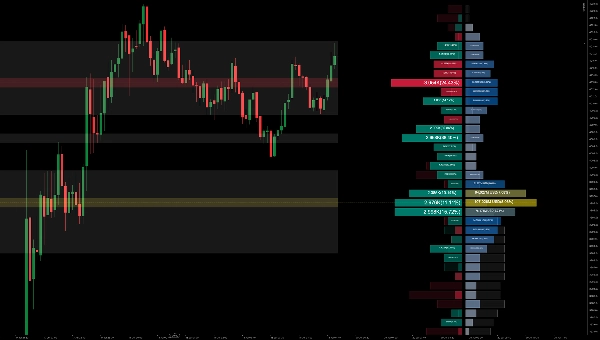
📊 Para Akışı Profili
Para Akışı Profili, belirli bir zaman diliminde piyasadaki tüm fiyat seviyelerinde işlem hacmini veya para akışını ölçen gelişmiş bir grafik aracıdır. Varlığın fiyatı ile alıcıların veya satıcıların istekliliği arasındaki ilişkiyi vurgular ve size şunları yapma imkanı tanır:
- Ana Fiyat Seviyelerini Ortaya Çıkarın: Kontrol Noktası (POC) gibi hacim kümelerini ve yüksek likidite düğümlerini kolayca tanımlayın.
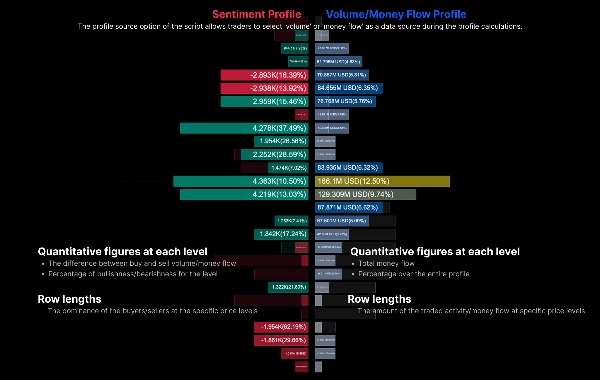
- Piyasa Duyarlılığını Analiz Edin: Sol tarafta Duyarlılık Profili ve sağ tarafta Hacim Profili göstererek, her belirli fiyat seviyesinde alıcıların mı yoksa satıcıların mı hakim olduğunu belirler.
- Dönemler Arası Karşılaştırma: Mevcut profili önceki dönemin hayalet profili ile doğrudan karşılaştırarak piyasanın ağırlık merkezindeki değişimleri gözlemleyin.
⚙️ Temel Parametreler ve Kullanım Kılavuzu
1. Genel Ayarlar
- Geriye Dönük Uzunluk / Sabit Aralık: Profili hesaplamak için kullanılan geçmiş bar sayısını tanımlar (örneğin, son 200 bar).
- Veri Kaynağı:
-
1 = Hacim: Profili geleneksel tick/işlem hacmine göre hesaplar.2 = Para Akışı: Para akışı dağılımını hesaplamak için fiyat derinliğini dahil eder.
2. Profil Ayarları
- Satır Çözünürlüğü (Satırlar): Dikey eksenin ayrıntı seviyesini belirler. Daha yüksek bir sayı (örneğin, 50-100) daha detaylı bir profil oluşturur.
- Profil Genişliği ve Yatay Ofset: Profilin ne kadar geniş çizileceğini (yüzde olarak) ve ne kadar sağa kaydırılacağını ayarlar, böylece mevcut mum çubuğuyla üst üste binmesini önler.
3. Duyarlılık ve Görüntüleme
- Duyarlılık Polaritesi:
-
1 = Mum: Sadece mumun açılış ve kapanışına (polarite) dayanarak yükseliş/düşüş duyarlılığını belirler.2 = Alış/Satış Baskısı: Fitiller ve yüksek/düşük göre kapanış gibi daha hassas hesaplamalar kullanır.
- Duyarlılık Profili / Hacim Profilini Göster: Net duyarlılık profilini (Sol) ve ana hacim profilini (Sağ) bağımsız olarak açıp kapama seçenekleri.
- Önceki Dönemi Göster: Etkinleştirildiğinde, önceki dönemin aynı zaman aralığını temsil eden arka plan "Hayalet Bar" profilini çizer. Destek/direnç değişimlerini takip etmek için mükemmeldir.
4. Genişletilmiş Alan Görüntüleme
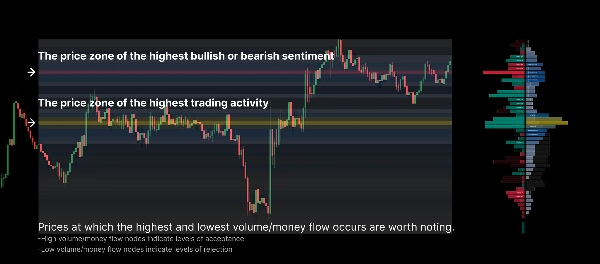
- Isı Haritasını Göster: Profil yoğunluğunu tüm hesaplama dönemi boyunca arka plan ısı haritası olarak projekte eder. "Hacim" veya "Duyarlılık" projelendirmeyi seçebilirsiniz.
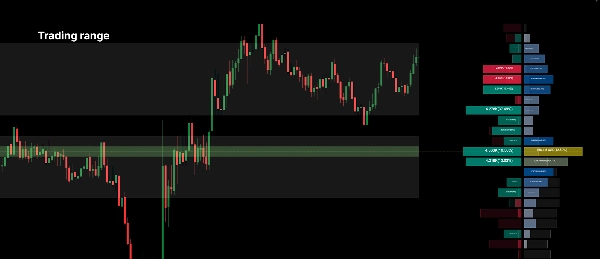
- Değer Alanını Göster: İşlem hacminin çoğunun gerçekleştiği temel fiyat aralığını vurgular. Eşik değeri özelleştirilebilir (örneğin, %70).
- POC Bölgesini Göster: Seçilen aralık için en yüksek hacme sahip fiyat seviyesi olan Kontrol Noktasında yatay bir çizgi ve bölge otomatik olarak çizer.
💡 Pratik Ticaret İpuçları:
- Güçlü destek veya direnç seviyeleri olarak hareket eden Yüksek Hacimli Düğümleri (Zirveler) araştırın.
- Fiyatın bu düşük likidite bölgelerinden hızla hareket etme eğiliminde olduğu Düşük Hacimli Düğümleri (Vadiler) araştırın.
- Önceki Dönem Hayalet Profilini kullanın: Mevcut POC (sarı çizgi) önceki dönemin POC'sinden daha yüksek oluşuyorsa, bu değer uzlaşmasının yukarı yönlü kaydığını gösterir ve genellikle yükseliş sinyalidir.
Özet
AI summary
Money Flow Profile is an advanced indicator that maps traded volume and market sentiment across price levels over a specified time period. It visualizes the relationship between price and trader activity, highlighting key liquidity zones such as volume clusters and the Point of Control (POC). The tool displays a Sentiment Profile on the left and a Volume Profile on the right, enabling users to assess whether buyers or sellers dominate at each price level. It supports direct comparison with the previous period’s profile via a ghost overlay to track shifts in market value consensus.
Core configurable parameters include lookback length, data source selection (volume or money flow), row resolution for vertical granularity, profile width and offset, and sentiment polarity calculation methods (candle-based or buy/sell pressure). Display options allow toggling of sentiment and volume profiles, previous period overlays, heatmaps of volume or sentiment density, value area highlighting, and automatic POC zone marking.
The indicator is designed to help identify strong support and resistance levels at high volume nodes and anticipate rapid price movements through low volume nodes. It supports detailed volume and sentiment analysis to inform trading decisions based on liquidity and market structure.
Core configurable parameters include lookback length, data source selection (volume or money flow), row resolution for vertical granularity, profile width and offset, and sentiment polarity calculation methods (candle-based or buy/sell pressure). Display options allow toggling of sentiment and volume profiles, previous period overlays, heatmaps of volume or sentiment density, value area highlighting, and automatic POC zone marking.
The indicator is designed to help identify strong support and resistance levels at high volume nodes and anticipate rapid price movements through low volume nodes. It supports detailed volume and sentiment analysis to inform trading decisions based on liquidity and market structure.
Gösterge profili
Gösterge kategorisi
Hacim
Çıktı türü
Görselleştirme
Veri gereklilikleri
Hacim
PD
Yalnızca çubuklar
Tick verisi
Desteklenen sinyaller
Kırılma
Trend gücü
Yön değiştirme
Volatilite
Seviyeye dokunuş
Seviye kırılması
Müşteri değerlendirmeleri
0.0
Değerlendirmeler: 0
Müşteri değerlendirmeleri
Bu ürün için henüz bir değerlendirme yok. Ürünü denediniz mi? O zaman ona dair görüşlerini paylaşan ilk kişi olun!
Tartışma
SSS
Key Levels
Volume
cTrader Store üzerinden erişilebilen işlem botları, göstergeler ve eklentiler gibi ürünler, üçüncü taraf sağlayıcılar tarafından sağlanır ve yalnızca bilgilendirme ve teknik erişim amaçlarıyla sunulur. cTrader Store bir broker değildir ve yatırım tavsiyesi, kişisel öneriler vermez veya gelecekteki performansı garanti etmez.
Bu oluşturanın diğer ürünleri





















Fiyat
534.4M
İşlem hacmi
9.76M
Kazanılan pip
4
Satışlar