
present
Registrieren Sie sich und erhalten Sie $50 Rabatt auf Ihren ersten Kauf
Trading product for TheVibe_NASDAQ_Liquidity_Cycles-v1.2.7 Indikator Signal Breakout, image 1
TheVibe_NASDAQ_Liquidity_Cycles-v1.2.7
Indikator
Version 1.0, Mar 2026
Windows, Mac
Bewertungen: 4
Trading product for TheVibe_NASDAQ_Liquidity_Cycles-v1.2.7 Indikator Signal Breakout, image 2
Trading product for TheVibe_NASDAQ_Liquidity_Cycles-v1.2.7 Indikator Signal Breakout, image 3
Trading product for TheVibe_NASDAQ_Liquidity_Cycles-v1.2.7 Indikator Signal Breakout, image 4
Trading product for TheVibe_NASDAQ_Liquidity_Cycles-v1.2.7 Indikator Signal Breakout, image 5
Trading product for TheVibe_NASDAQ_Liquidity_Cycles-v1.2.7 Indikator Signal Breakout, image 6
Seit 05/02/2026

Beschreibung

TheVibe NASDAQ Liquidity Cycles ist ein professioneller Sitzungs-Highlighter, der speziell für den NASDAQ 100 entwickelt wurde. Er eliminiert die Notwendigkeit, Zeitzonendifferenzen manuell zu verfolgen oder zu erraten, wann das Volumen ansteigen wird, indem er die genauen Marktzeiten von New York visuell direkt vor Ihnen anzeigt.

Da die Logik auf absoluter Zeit statt auf Balkenzählungen basiert, ist dieser Indikator völlig zeitrahmenunabhängig – er funktioniert einwandfrei, egal ob Sie auf einem 1-Minuten-Chart scalpen oder auf einem 1-Stunden-Chart Swing-Trading betreiben.

Für wen ist das und wie benutzt man es: Dieser Indikator ist speziell für Daytrader und Momentum-Trader entwickelt, die auf präzises Timing und reine volumengetriebene Volatilität für ihre Setups angewiesen sind.

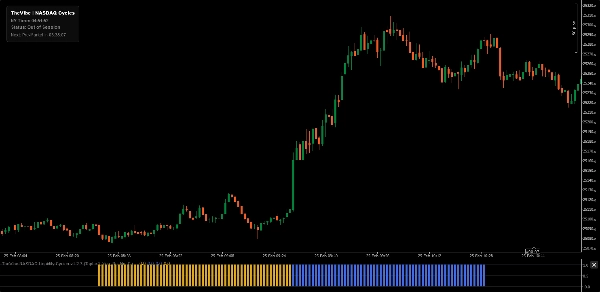
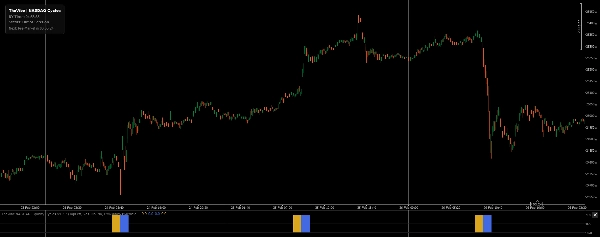
  • Interpretation: Der Indikator zeigt solide, farbcodierte Histogrammblöcke im Unterfenster an, wann immer eine wichtige Liquiditätssitzung aktiv ist. Indem diese Timing-Daten visuell auf Ihrem Bildschirm abgebildet sind, können Sie Ihr Trading mühelos mit hochwahrscheinlichen Zeitfenstern ausrichten und unruhige, liquiditätsarme Phasen vermeiden, ohne jemals eine externe Uhr überprüfen zu müssen.

Erfasste Kern-Liquiditätsphasen:

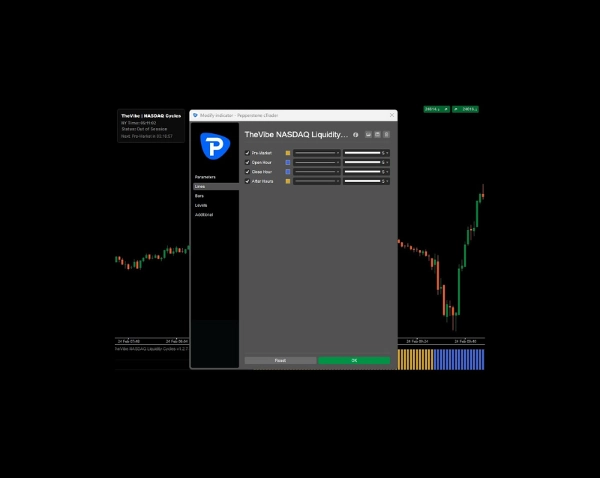
  • Pre-Market (8:30 AM - 9:30 AM NY): Die institutionelle Pre-Market-Stunde, mit Fokus auf Nachrichten mit hoher Auswirkung und frühe Positionierungen.
  • Open Hour (9:30 AM - 10:30 AM NY): Das Eröffnungsvolatilitätsfenster, entscheidend für die erste Preisfindung und den Volumenzufluss.
  • Close Hour (3:00 PM - 4:00 PM NY): Die „Power Hour“ und der Closing Cross, die den institutionellen Schwung am späten Tag und das Schließen von Positionen hervorheben.
  • After Hours (4:00 PM - 5:00 PM NY): Die Nachmarkt-Abrechnungsstunde, die die letzte Liquiditätsphase erfasst, wenn der reguläre Handel endet.

Hauptmerkmale:

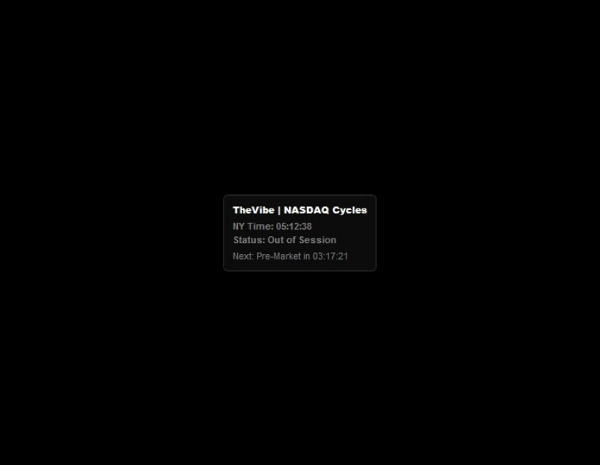
  • Interaktives Countdown-Dashboard: Ein dynamisches HUD auf dem Chart, das die genaue New Yorker Zeit, Ihre aktuell aktive Sitzung und einen Live-Countdown bis zum nächsten Liquiditätsfenster anzeigt.
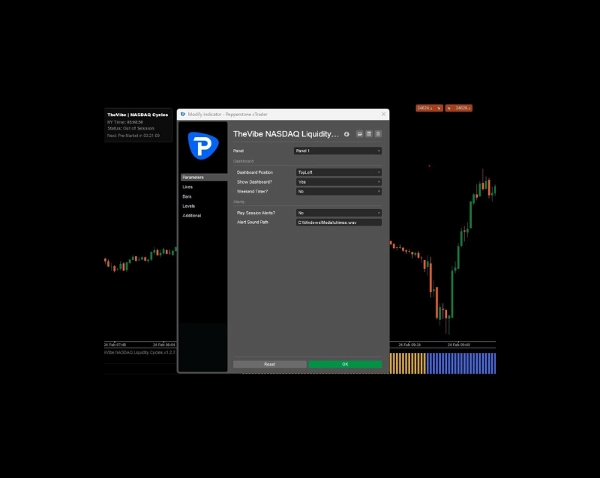
  • Dynamische Positionierung: Befestigen Sie das Dashboard an einer der vier Ecken Ihres Charts (Standard ist unten links), um Ihre Kursbewegung vollständig ungestört zu halten.
  • Fortschrittliche Zeitzonen-Engine: Synchronisiert automatisch Ihre lokale oder Broker-Server-Zeit mit der genauen New Yorker Zeit (handhabt EST/EDT automatisch).
  • Intelligente Wochenend-Logik: Wählen Sie, ob der Countdown am Wochenende ausgeblendet oder die genauen verbleibenden Tage und Stunden bis zur Pre-Market-Eröffnung am Montag angezeigt werden soll.
  • Audio-Benachrichtigungen: Optionale Benachrichtigungstöne, die genau beim Öffnen oder Schließen eines gezielten Liquiditätsfensters ausgelöst werden.

Anzeigeempfehlung: Für ein optimales Arbeitsbereichsmanagement passen Sie die Höhe des Unterfensters des Indikators auf eine kompakte Größe an. So erhalten Sie eine klare, unaufdringliche „Rhythmusleiste“ der Tagesliquidität und bewahren gleichzeitig maximalen Bildschirmplatz für Ihr Hauptkursdiagramm.

Hinweis: Der automatisierte Countdown-Timer geht von den regulären Handelszeiten Montag bis Freitag aus und berücksichtigt nicht automatisch US-Feiertage oder vorzeitige Marktschließungen.

Zusammenfassung

KI-Zusammenfassung
TheVibe NASDAQ Liquidity Cycles is an indicator designed for the NASDAQ 100 that visually maps key liquidity sessions on trading charts using exact New York market time. It highlights four core liquidity phases: Pre-Market (8:30–9:30 AM NY), Open Hour (9:30–10:30 AM NY), Close Hour (3:00–4:00 PM NY), and After Hours (4:00–5:00 PM NY). The indicator plots color-coded histogram blocks in a sub-window to indicate active liquidity sessions, enabling traders to align their strategies with high-volume periods without manual time zone calculations.

This timeframe-agnostic tool works across all chart intervals, from 1-minute scalping to 1-hour swing trading. It features an interactive countdown dashboard displaying current New York time, active session, and time remaining until the next liquidity window. The dashboard can be positioned in any chart corner to avoid obstructing price data. An advanced timezone engine synchronizes local or broker server time with New York time, automatically adjusting for EST/EDT. Additional features include smart weekend logic to manage countdown display and optional audio alerts signaling session openings and closings.

The indicator is intended for day and momentum traders relying on volume-driven volatility and precise timing. For optimal use, it is recommended to keep the sub-window compact to maintain chart clarity.
Indikatorprofil

Kundenbewertungen

4.2
Bewertungen: 4
5
25 %
4
75 %
3
0 %
2
0 %
1
0 %
Kundenbewertungen
March 15, 2026
The workflow feels calmer, but it can look better than it is during a lucky run.
March 9, 2026
The cleanest use is the checklist feels less annoying.
March 7, 2026
not bad if the rules are already clear, and It should not replace the chart.
March 3, 2026
the first impression improves when messy ideas reach the journal less often. Wrong inputs can break the setup.

Diskussion

Häufig gestellte Fragen (FAQ)

Signal
Breakout
Indices
NAS100
ATR
Über den cTrader Store verfügbare Produkte, einschließlich Handelsbots, Indikatoren und Plugins, werden von externen Entwicklern bereitgestellt und nur zu Informations- und technischen Zugriffszwecken verfügbar gemacht. cTrader Store ist kein Broker und erbringt keine Anlageberatung, persönlichen Empfehlungen oder eine Garantie für zukünftige Performance.

Das könnte Sie auch noch interessieren

Indikator
Doji
Engulfing
+3
Multi Timeframe OHLC levels (daily, weekly, and monthly), with a two-day price action bias dashboard
Indikator
Forex
BTCUSD
+11
📈 Adaptive ALMA-Gaussian hybrid trend filter with precision smoothing and clear buy/sell signals.
Indikator
ATR
Volume
+4
Advanced broker tick-volume profile with estimated POC, VAH/VAL, estimated HVN/LVN and session/lookback context.
Indikator
BOS
MSS
+5
One indicator, full ICT/SMC picture — structure, OBs, FVGs, liquidity, Premium/Discount — with graded PRIME/SETUP signal
Indikator
ATR
Channel
Reversal Trap Probability Bands plots a dynamic volatility envelope around price & automatically detects "trap" reversal
Indikator
AI
SMC
+7
The ultimate tool for Price Action and ICT. High, Low and Mid levels for days, weeks Inc. NY Midnight and Custom Range.
Indikator
MCDX is a powerful and innovative indicator.
Indikator
AI
ATR
+27
Smart Money Gaps: MTF FVG auto-detection, extension, and mitigation marker. Trade institutional imbalances.
Indikator
Prop
Forex
+9
Average Cost Price helps you keep track of your open positions on the chart. In doing so, it provides lines and explanat
Indikator
Advanced customizable volume-profile indicator with buy/sell levels, delta analysis, multi-TF support and vivid gradient
Indikator
Prop
Forex
+12
⚡ ADXVMA Aurora Trend Filter combines ADX trend strength with an adaptive EMA blend ⚡
Indikator
Forex
Crypto
+5
🚀 Automated Elliott Wave & Fibonacci tool for cTrader. Spot trends, corrections & retracements fast.
Indikator
Prop
Forex
+11
Ultimate Session Tool: Boxes, OR, KZs, PD Levels, Overlaps, Custom Lines & Names, Info Panel! Highly customizable 📉📈
Indikator
📊 Smart Floating Risk Pro – Advanced Risk Management for cTrader
Indikator
SMC
Prop
+17
Unlock the true intent of market participants with the Classic Proportional Cumulative Volume Delta CVD!
Indikator
ATR
RSI
+19
Multi-timeframe heatmap scoring Direction, Strength & Volatility at a glance!
Indikator
Volume
Channel
+5
Spots volatility squeezes before they fire — the compression phase everyone else misses.
Indikator
Customizable window inside your platform, access to any website Calendar

Preis

Seit 05/02/2026