
Açıklama
Jurik düzeltmesi 3 aşamadan oluşur:
1. aşama - uyarlanabilir EMA ile ön düzeltme: MA1 = (1-alpha)*Price + alpha*MA1[1];
2. aşama - Kalman filtresi ile bir ön düzeltme daha: Det0 = (Price - MA1)*(1-beta) + beta*Det0[1]; MA2 = MA1 + PR*Det0;
3. aşama - benzersiz Jurik uyarlanabilir filtresi ile son düzeltme: Det1 = (MA2 - JMA[1]) * (1-alpha)^2 + alpha^2 * Det1[1]; JMA = JMA[1] + Det1;
burada: - Price - Fiyat Serisi - alpha - dinamik faktör (aşağıda açıklanacaktır) - beta - periyodik oran = 0.45*(Length-1)/(0.45*(Length-1)+2) - PR - Faz Oranı: PR = Phase/100 + 1.5 (eğer Phase < -100 ise PR=0.5, eğer Phase > 100 ise PR=2.5).
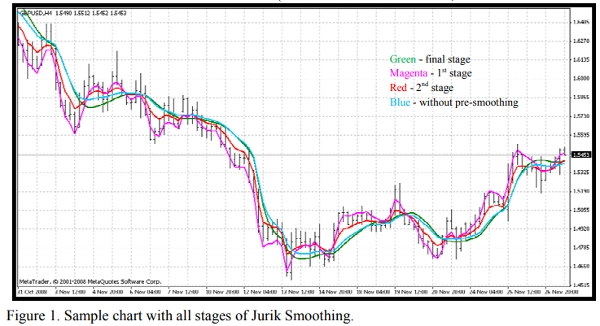
Şekil 1. Jurik Düzeltmesinin tüm aşamalarını içeren örnek grafik. Ekli gösterge JurikFilter_v2 ile her aşamanın sonuçlarını (Şekil 1) görebilirsiniz, FilterMode değiştirerek: 0 - son aşama (JMA) 1 - 1. aşama 2 - 2. aşama 3 - sadece son (ön düzeltmesiz) düzeltme.
Dinamik Faktör, bir kuvvet (pow) ile yükseltilmiş periyodik faktör (beta) dir:
alpha = beta ^ Pow,
burada: - pow = rVolty ^ pow1 - rVolty - göreceli fiyat volatilitesi - pow1 - göreceli volatilitenin gücü, aşağıdaki formülle: pow1 = len1 - 2 (eğer pow1 < 0.5 ise pow1 = 0.5),
burada len1 - ek periyodik faktör: len1 = Log(SquareRoot(len))/Log(2.0) + 2 (eğer len1 < 0 ise len1 = 0).
Böylece Dinamik faktörün, bu tür fiyat filtresi için gereken uyarlanabilirliği sağlayan göreceli fiyat volatilitesine dayandığını görebilirsiniz.
Göreceli fiyat volatilitesi formülü rVolty = Volty/AvgVolty (eğer rVolty > len1^(1/pow1) ise rVolty = len1^(1/pow1), eğer rVolty < 1 ise rVolty = 1),
burada:
- Volty - sözde Jurik Bantlarının (VisualMode = 1) hesaplanmasına dayanan fiyat volatilitesi.
- AvgVolty - Jurik'in karmaşık bir hesaplama algoritması kullandığı ortalama volatilite: AvgVolty = Average(vSum,AvgLen),
burada:
- vSum - (Volty - Volty[10])/10'un artan toplamı;
- AvgLen - ortalama periyodu (Jurik 65 kullanır).
Benim Jurik Filtre versiyonumda Jurik'in karmaşık ortalamasının yerine basit ortalama kullanıyorum
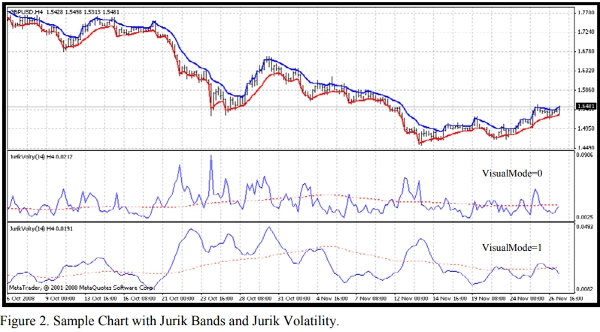
Ayrıca, ekli gösterge JurikVolty_v1 (Şekil 2) ile Volty (VisualMode=0), vSum (VisualMode=1) ve AvgVolty (kırmızı noktalı çizgi) değerlerini görebilirsiniz.
Fiyat volatilitesi formülü Volty = Abs(del1) ve Abs(del2) arasındaki maksimumdur, eğer Abs(del1) = Abs(del2) ise Volty = 0,
burada: - del1 - fiyat ile üst bant arasındaki mesafe del1 = Price - UpperBand - del2 - fiyat ile alt bant arasındaki mesafe del2 = Price - LowerBand Jurik Bantları, Bollinger, Keltner, Donchian, Fraktal gibi bilinen herhangi bir fiyat bandından farklıdır: eğer del1 > 0 ise UpperBand = Price aksi takdirde UpperBand = Price - Kv*del1 eğer del2 < 0 ise LowerBand = Price aksi takdirde LowerBand = Price - Kv*del2,
burada: - Kv - volatilite faktörü Kv = bet ^ SquareRoot(pow2). Bu bantların Wilder'ın Parabolik gibi trend takip göstergeleri için temel olabileceğini görmek kolaydır. Böylece, Jurik Hareketli Ortalaması (JMA) algoritmasında pratikte belirsiz yerler olmadığını görebilirsiniz
Özet
Müşteri değerlendirmeleri
5 | 0 % | |
4 | 100 % | |
3 | 0 % | |
2 | 0 % | |
1 | 0 % |

!["[Hamster-Coder] Bollinger Bands" logosu](https://cdn.ctrader.com/image/webp/21d8e5d6-fb11-4bac-b9ee-cd05c2b76804_30327)


