present
Kaydolun ve ilk alışverişinizde $50 indirim kazanın
Trading product for TradeLens Gösterge Chart UI Tools Key Levels, image 1
TradeLens
Gösterge
Sürüm 1.3, Sep 2026
Windows, Mac
4.5
Değerlendirmeler: 4
Trading product for TradeLens Gösterge Chart UI Tools Key Levels, image 2
Trading product for TradeLens Gösterge Chart UI Tools Key Levels, image 3
Trading product for TradeLens Gösterge Chart UI Tools Key Levels, image 4
Trading product for TradeLens Gösterge Chart UI Tools Key Levels, image 5
Trading product for TradeLens Gösterge Chart UI Tools Key Levels, image 6
Trading product for TradeLens Gösterge Chart UI Tools Key Levels, image 7
Trading product for TradeLens Gösterge Chart UI Tools Key Levels, image 8
Trading product for TradeLens Gösterge Chart UI Tools Key Levels, image 9
Trading product for TradeLens Gösterge Chart UI Tools Key Levels, image 10
Trading product for TradeLens Gösterge Chart UI Tools Key Levels, image 11
Başlangıç 09/02/2026
29
Satışlar
179
Ücretsiz yüklemeler

Açıklama

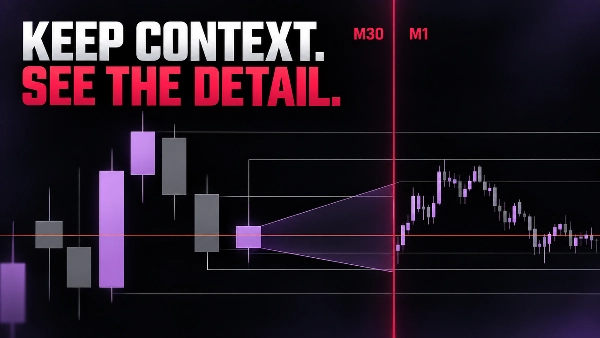
TRADELENS - BAĞLAMI KORUYUN. DETAYA BAKIN.

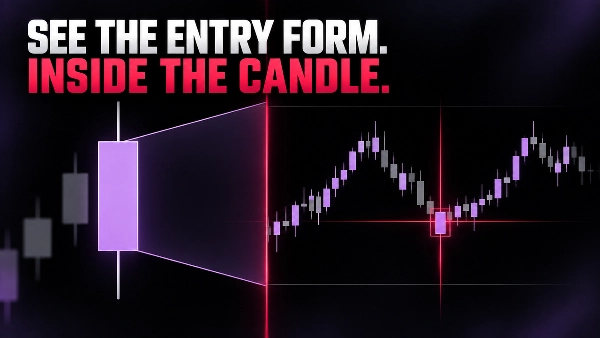
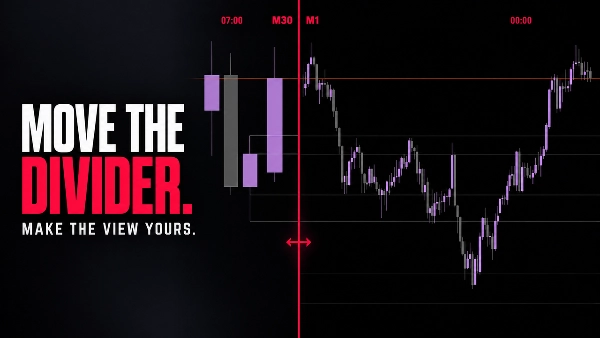
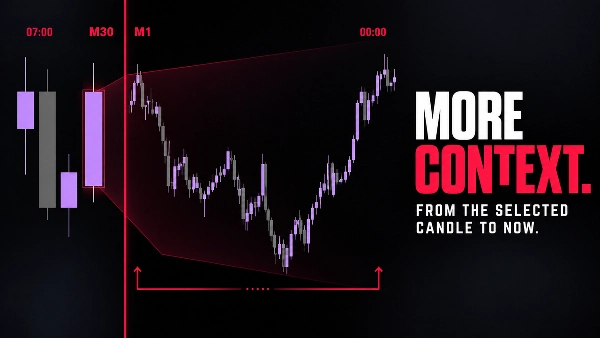
TradeLens, mevcut grafiğinizin içine kompakt bir alt zaman dilimi mum görünümü yerleştirir. Orijinal grafik, daha yüksek zaman dilimi bağlamınız olarak kalır; detay paneli, seçilen bağlam mumunun içindeki fiyat gelişimini gösterir.

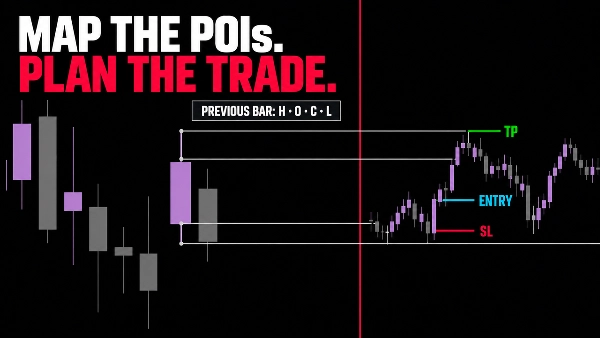
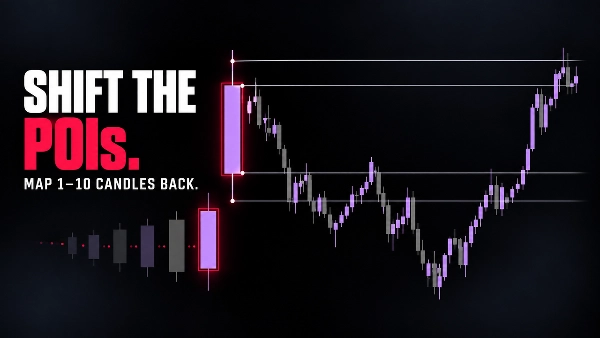
Varsayılan olarak şu anda oluşan mumu kullanın veya daha önceki bir bağlam mumunu incelemek için geriye kaydırın. Aktif kurulumu, önceki kapanmış barın Yüksek, Düşük, Açılış ve Kapanış noktalarında isteğe bağlı POI'ler (ışınlar) ile çerçeveleyebilir ve grafikten ayrılmadan alt zaman dilimi hareketini inceleyebilirsiniz.

TRADELENS'İN GÖRÜNÜMÜNÜZÜ NASIL YARDIMCI OLUR

  • Aynı pencerede daha yüksek zaman dilimi yapısı ve daha düşük zaman dilimi detayı.
  • Mevcut bağlam mumunun daha ince ölçekte ilerleyişi.
  • Grafikte önceki barın OHLC ilgi noktaları.
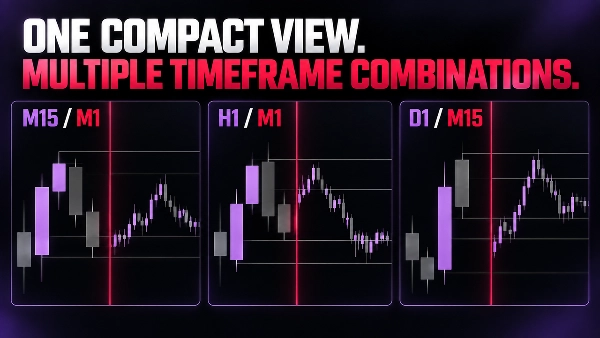
  • M15/M1, M30/M1, H1/M1, D1/M15 ve D1/M30 gibi kompakt kombinasyonlar.
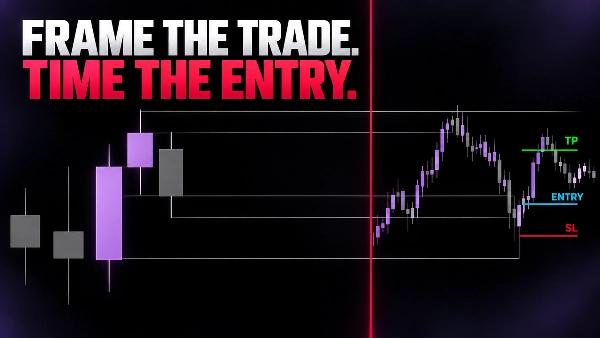
  • Bağlamı korurken giriş zamanlamasını daha temiz bir şekilde iyileştirme yolu.
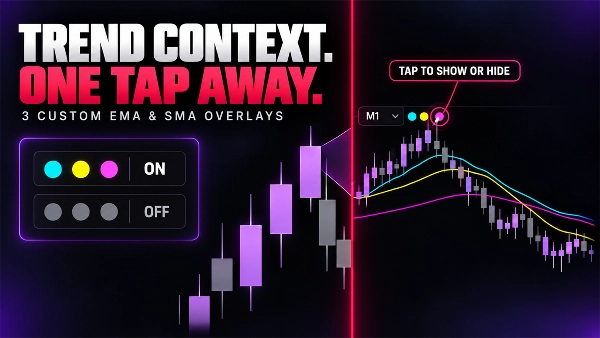
  • Üç adede kadar özelleştirilebilir EMA veya SMA katmanı ekleyin.
  • Her ortalamayı tek dokunuşla anında gösterin veya gizleyin.
  • Alt zaman dilimi görünümünde doğrudan trend yönünü görün.

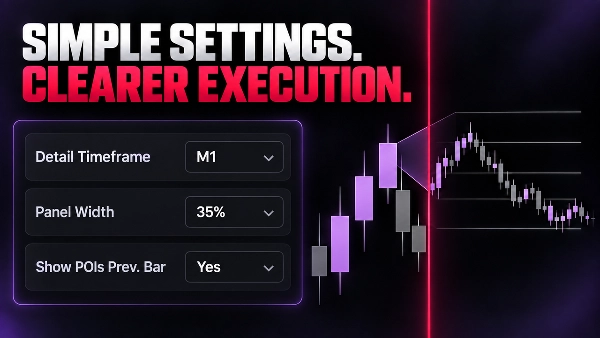
BASİT, GÖRSEL KONTROLLER

  • Detay zaman dilimi ve bağlam mumu kaydırma.
  • Detay paneli genişliği, arka plan ve opaklık.
  • Boğa, ayı, ayırıcı ve etiket renkleri.
  • Yapılandırılabilir renk ve kalınlığa sahip isteğe bağlı önceki bar POI'leri.

Detay zaman dilimi, grafik zaman diliminden daha küçük olmalıdır. Kombinasyon geçersizse, TradeLens görselleştirmesini gizler ve net bir yapılandırma bandı gösterir.

TradeLens görsel bir analiz aracıdır. Emir vermez, değiştirmez veya yönetmez. Galeride gösterilen örnekler, grafik okuma iş akışını gösterir ve ticaret önerisi veya performans garantisi değildir.


Özet

YZ özeti
TradeLens is a chart visualization tool designed to integrate two timeframes within a single trading chart. It embeds a compact lower-timeframe candle view inside the current higher-timeframe chart, allowing traders to observe detailed price action within the context of a broader market structure. Users can analyze the progression of the current or previous context candles at a finer scale without switching charts.

Key features include optional points of interest (POIs) marking the previous bar’s Open, High, Low, and Close levels, customizable visual settings such as detail panel size, background opacity, and color schemes for bullish, bearish, and separator elements. TradeLens supports common timeframe combinations like M15/M1, M30/M1, H1/M1, D1/M15, and D1/M30, ensuring the detail timeframe is always smaller than the context timeframe.

This tool facilitates refined entry timing by preserving higher-timeframe context while providing granular lower-timeframe insights. It is a visual analysis indicator and does not execute or manage trades. TradeLens is tagged under market structure and chart UI tools, supporting analysis related to key levels, liquidity sweeps, market structure changes, and inducements.
Gösterge profili
Gösterge kategorisi
Piyasa yapısı (SMC)
Çıktı türü
Görselleştirme
Veri gereklilikleri
Yalnızca çubuklar

Tartışma

Müşteri değerlendirmeleri

4.5
Değerlendirmeler: 4
5
50 %
4
50 %
3
0 %
2
0 %
1
0 %
Müşteri değerlendirmeleri
October 24, 2026
smaller candles inside the larger one are an elegant way to retain the path within the wider move, with optional previous OHLC giving the comparison useful reference points instead of adding entry signals.
October 8, 2026
M1 candles inside an H1 candle keep the little moves and the bigger picture together. Previous OHLC can be added when needed. A handy comparison overlay, with the detail period required to stay smaller than the context period.
October 4, 2026
TradeLens displayed an embedded M1 candle view on EURUSD H1 and XAUUSD H1, M10 and Month1. Three moving averages, timeframe labels and the separator were visible. The invalid M1/M1 combination correctly triggered a clear warning. The interface works well, although low contrast and compressed detail candles can affect readability, especially on higher timeframes.
October 2, 2026
keeping M1 detail inside H1 context is a useful comparison view, with optional previous OHLC references and a clear requirement for the detail period to remain smaller than the larger candle.

SSS

Chart UI Tools
Key Levels
Liquidity Sweep
CHOCH
Inducement
Market Structure
Liquidity Grab
cTrader Store üzerinden erişilebilen işlem botları, göstergeler ve eklentiler gibi ürünler, üçüncü taraf sağlayıcılar tarafından sağlanır ve yalnızca bilgilendirme ve teknik erişim amaçlarıyla sunulur. cTrader Store bir broker değildir ve yatırım tavsiyesi, kişisel öneriler vermez veya gelecekteki performansı garanti etmez.

Bu oluşturanın diğer ürünleri

Gösterge
BOS
CHOCH
+5
Spot market structure shift with ease, overlay timeframes, avoid false breakouts with open close pivots, hide chart bars
Gösterge
Volume
Imbalance
+5
Spot Institutional Order Flow with Proportional Volume Bubbles & Integrated Cumulative Volume Delta (CVD) Intelligence.
Gösterge
Forex
EURUSD
+5
Fimathe Indicator - Fimathe PCM - Automated Trend Channels & Levels — Ideal for live trading and backteting
"ZigXRay" logosu
En yüksek puanlı
4.6
(5)
$29
/
$49
Gösterge
CHOCH
Key Levels
+5
ZigZag Market Structure Identifier - Multi-Layer Scanner: Convergent Pivot Detection, 4-TF Overlay & Naked Chart Mode.
Masaüstü eklentisi
Risk/Reward
Trade Journal
+5
cTrader Journal - Automatic Trade Capture. Offline Reviews. No Subscription.
"DrbcLevels" logosu
En yüksek puanlı
4.0
(4)
$19
/
$29
Gösterge
Key Levels
Break & Retest
+5
Premium Discount Levels - Professional Dealing Range Zones with Draggable Lines, Alerts, Wartermark & Backtest Mode.
cBot
Fixed Lot
TP Manager
+5
Hotkeys Trading Assistant - Professional Shortcut Assitant with Risk Manager, Hotkeys & Lot Sizing.
"fvg_levels" logosu
En yüksek puanlı
4.0
(4)
$19
/
$29
Gösterge
Key Levels
Order Block
+5
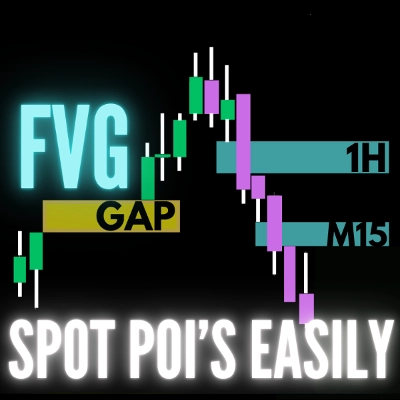
FVG Levels — Auto-Detection of Multi-Timeframe Fair Value Gaps & GAPs, Smart Filters and Liquidity Zone Monitoring

Şunları da beğenebilirsiniz

Gösterge
VWAP
Volume
+4
Volume Profile + VWAP with Standard Deviations
Gösterge
SMC
Prop
+14
Right-anchored cTrader Volume Profile with VAH/VAL/POC, LVZ, top volume+EMA, themes, and fast, readable visuals.
Gösterge
Forex
Alerts you when price touches Fibonacci levels. Stay organized and trade efficiently!
Gösterge
ATR
RSI
+5
Delta RSI Candle Pro, the indicator that transforms ordinary candlesticks into powerful momentum visualizers.
Gösterge
Forex
Crypto
+2
Market Structure Indicator – Your Trading Map in a Noisy Market. No more Panicking Which one, Where, Why and How.
Gösterge
Doji
Volume
+5
Instantly spot high-liquidity institutional moves with clean, non-obtrusive triangle alerts on cTrader charts.
Gösterge
Prop
Forex
+4
Universal multi time frame 'Moving Average' indicator with extended features
Gösterge
ATR
RSI
+6
Market structural patterns , specifically the concepts of Change of Character (ChoCH) 🔄 and Break of Structure (BoS) 💥
Gösterge
Volume
Channel
+2
Identify key support and resistance levels through detailed volume distribution analysis.
Gösterge
Prop
Forex
+5
🎯 Order Block Detector - Smart Trading: Identifica bloques de órdenes clave en cTrader para un trading más inteligente.
Gösterge
AI
ATR
+27
Nadaraya-Watson Envelope Indicator
Gösterge
Volume
Key Levels
+1
Session volume profiles from tick volume: POC, value area high and low, and naked POCs extended until touched.
Gösterge
Key Levels
Trend-filtered signals, transparent trade plans and a multi-timeframe decision panel for cTrader.
Gösterge
BOS
EMA
+5
Market structure signals graded A to C, each with a drawn trade plan, plus an adaptive trend ribbon and a trend matrix
Gösterge
BOS
CHOCH
+4
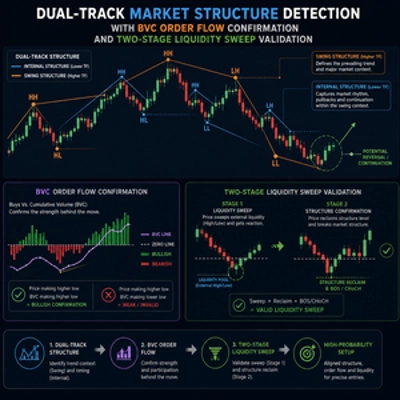
Dual-track market structure detection with BVC order flow confirmation and two-stage liquidity sweep validation.
Gösterge
VWAP
Support & Resistance
Trading.FC$_vwap Algo shows VWAP trends, dynamic support/resistance and deviation bands to spot potential trade entries.
Gösterge
ATR
Forex
+6
UT Bot Alerts Nova: Advanced trend-following indicator using ATR for signals. Precise entries/exits.
Gösterge
Forex
Crypto
+4
Pro Heikin Ashi Visual Overlay – Clean Trend Visualization

Fiyat

Başlangıç 09/02/2026
29
Satışlar
179
Ücretsiz yüklemeler