
Side Volume Profile
Indikator
11 pembelian
Versi 1.0, Aug 2025
Windows, Mac
4.3
Ulasan: 3
Sejak 26/05/2025
385.09M
Volum yang didagangkan
60.66K
Pip dimenangi
14
Jualan
1.4K
Pemasangan percuma
Penerangan
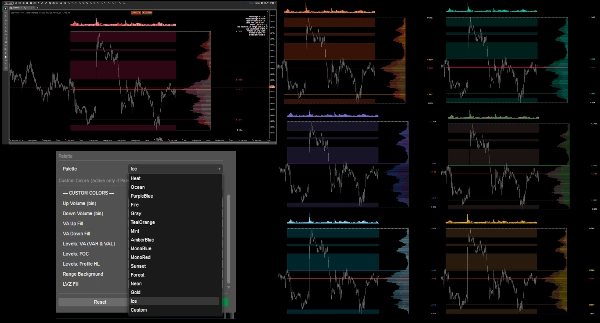
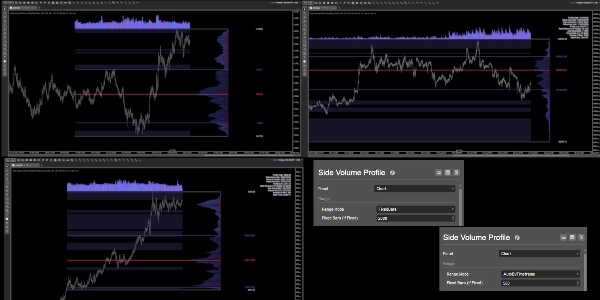
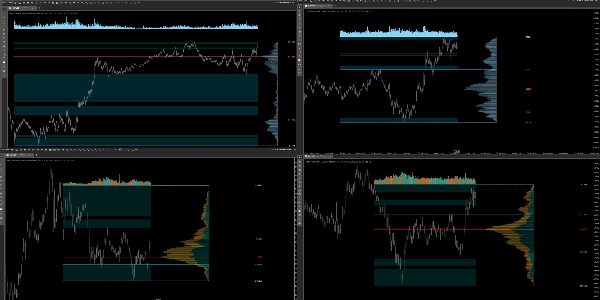
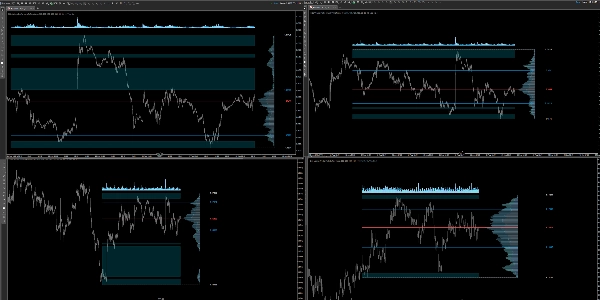
Profil Isipadu sebelah kanan, yang sentiasa dipasang pada bar terakhir dan tidak melompat apabila anda menggeser carta. Ia mengira isipadu mengikut harga dalam julat yang dipilih (auto mengikut jangka masa atau bilangan bar tetap), menunjukkan POC, VAH/VAL, sempadan profil (Tinggi/Rendah), menyerlahkan zon isipadu rendah (LVZ), dan melukis histogram isipadu dengan EMA di atas julat (offset dalam pips). Termasuk panel statistik di kanan atas, beberapa palet kontras tinggi serta warna tersuai, kelegapan bin global, kawalan lebar/offset, dan ketebalan/gaya setiap garis. Dibina untuk kebolehbacaan dan prestasi.
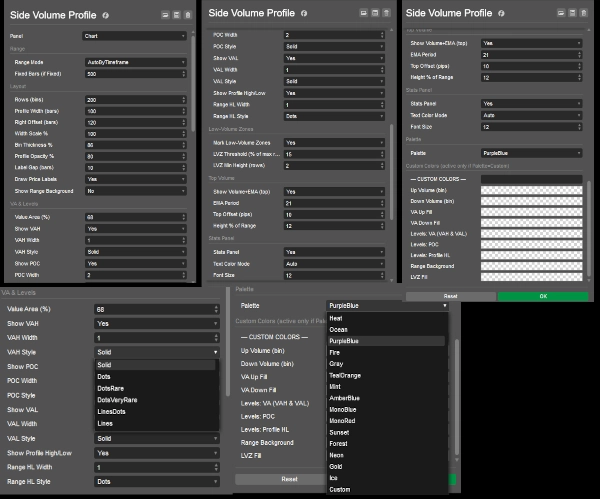
- Julat: AutoByTimeframe atau FixedBars.
- Susun Atur: Baris (bin), Lebar Profil / Skala Lebar, Offset Kanan, Ketebalan Bin, Jurang Label, kelegapan profil; latar julat pilihan.
- VA & Tahap: Peratus Kawasan Nilai, togol VAH/POC/VAL, lebar & gaya garis setiap tahap; Tinggi/Rendah profil.
- Zon Isipadu Rendah: Ambang (% daripada baris maks) dan ketinggian minimum (baris).
- Isipadu Teratas: Tempoh EMA, ketinggian (% daripada julat), offset lalai 10 pips.
- Palet/Tersuai: Pilih tema atau tetapkan warna anda sendiri (VAH = VAL).
- Panel Statistik: Togol, saiz fon
Dokumentasi penunjuk
Ringkasan
Ringkasan AI
Side Volume Profile is a right-anchored volume profile indicator designed for cTrader that displays volume-by-price data over a selectable range, either automatically by timeframe or a fixed number of bars. It visualizes key volume levels including Point of Control (POC), Value Area High (VAH), Value Area Low (VAL), and profile bounds (high/low). The indicator highlights low-volume zones (LVZ) based on configurable thresholds and minimum heights. It also features a volume histogram with an exponential moving average (EMA) offset in pips above the profile range.
Users can customize the layout with controls for row bins, profile width and scale, right offset, bin thickness, label gaps, and opacity. Line widths and styles for VAH, POC, VAL, and profile bounds are adjustable. Multiple high-contrast color palettes and custom color options are available. A toggleable top-right statistics panel provides summary data with adjustable font size.
The indicator supports various markets including Forex, indices, commodities, cryptocurrencies, and stocks, with tags referencing symbols like BTCUSD, EURUSD, GBPUSD, XAUUSD, NAS100, and USDJPY. It is built for readability and performance, maintaining a stable position on the chart without shifting when panning.
Profil indikator
Ulasan pelanggan
4.3
Ulasan: 3
5 | 33 % | |
4 | 67 % | |
3 | 0 % | |
2 | 0 % | |
1 | 0 % |
Ulasan pelanggan
Perbincangan
Soalan Lazim
BTCUSD
Forex
Indices
EURUSD
Commodities
GBPUSD
NZDUSD
Prop
Fair Value Gap
SMC
Crypto
Stocks
XAUUSD
NAS100
USDJPY
VWAP
Produk yang tersedia melalui cTrader Store, termasuk bot dagangan, indikator dan plugin, disediakan oleh pembangun pihak ketiga dan diberikan akses untuk tujuan maklumat dan teknikal sahaja. cTrader Store bukan broker dan tidak memberikan nasihat pelaburan, syor peribadi atau sebarang jaminan prestasi masa hadapan.


Harga
Sejak 26/05/2025
385.09M
Volum yang didagangkan
60.66K
Pip dimenangi
14
Jualan
1.4K
Pemasangan percuma