Penerangan
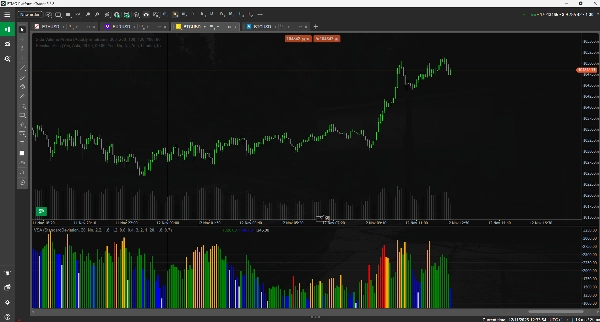
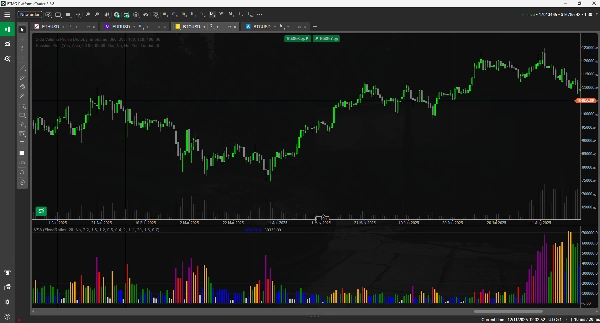
Penunjuk volum pelbagai mod yang maju dengan tiga mod analisis yang berbeza. Tukar antara mereka dengan serta-merta untuk menyesuaikan gaya dagangan anda.
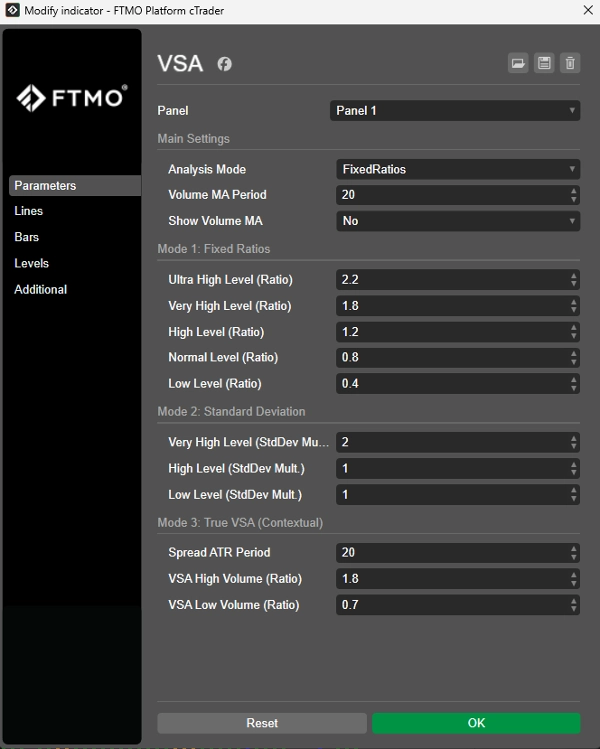
Mod 1: Nisbah Tetap
Mengkategorikan volum dengan membandingkannya dengan purata bergeraknya yang didarabkan dengan nisbah tetap yang ditetapkan pengguna (contohnya, 2,0x untuk "Tinggi").
Terbaik untuk: Pedagang yang lebih suka kawalan manual dan ambang tetap.
Mod 2: Sisihan Piawai (Adaptif)
Mod ini secara automatik menyesuaikan dengan turun naik pasaran. Ia mengkategorikan volum berdasarkan berapa banyak sisihan piawai ia dari purata (purata bergerak).
Terbaik untuk: Alat adaptif yang berfungsi "secara langsung" pada mana-mana instrumen atau jangka masa.
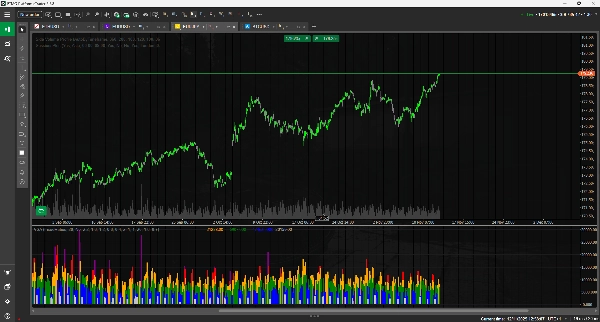
Mod 3: VSA Sebenar (Kontekstual)
Pendekatan klasik dan profesional. Mod ini menganalisis konteks bar dengan menggabungkan Volum + Julat (Range) + Posisi Tutup untuk mengenal pasti isyarat utama.
Ringkasan
1. Fixed Ratios mode categorizes volume by comparing it to a moving average multiplied by user-defined fixed ratios, providing manual control over volume thresholds.
2. Standard Deviation mode adapts automatically to market volatility by classifying volume based on its deviation from the moving average, suitable for use across various instruments and timeframes without manual adjustment.
3. True VSA (Contextual) mode applies a professional volume spread analysis by evaluating volume in conjunction with bar range and close position to identify key market signals.
This multi-mode indicator supports a wide range of markets including Forex, cryptocurrencies (e.g., BTCUSD, ETH), commodities (e.g., gold, oil), indices (e.g., NAS100, SP500), and stocks. It enables traders to switch instantly between modes to align with their preferred analysis style and trading strategy.
Ulasan pelanggan
5 | 100 % | |
4 | 0 % | |
3 | 0 % | |
2 | 0 % | |
1 | 0 % |