
Market Entropy
Indikator
107 muat turun
Versi 1.0, Aug 2025
Windows, Mac
Sejak 26/05/2025
388.58M
Volum yang didagangkan
60.75K
Pip dimenangi
15
Jualan
1.41K
Pemasangan percuma
Penerangan
Market Entropy adalah penunjuk dwi (osilator + lapisan harga pilihan) yang mengukur organisasi pasaran dan menandakan peralihan rejim merentasi Order → Transition → Chaos. Ia menambah satu garis kedua, Trendness (DC), untuk membezakan tren sebenar daripada pengepaman volatiliti.
Bagaimana ia berfungsi:
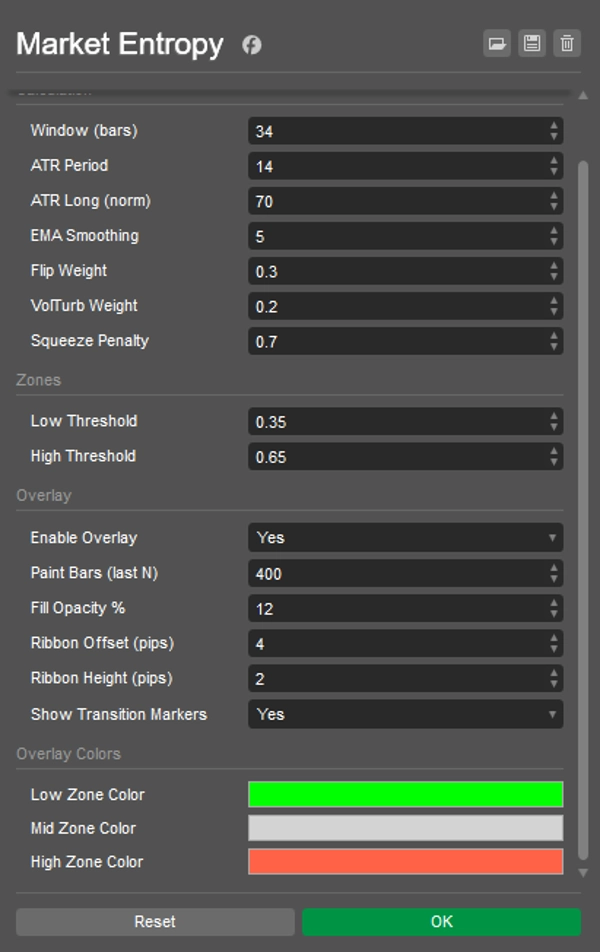
- Menggunakan hanya komponen OHLCV: DC (konsistensi arah), FlipRate (pembalikan tanda), Volatility_n (ATR/ATRlong), VolumeTurb (sisihan piawai ΔVolume).
- Entropi mentah:
E0 = 0.5*(1-DC) + 0.3*(FlipRate*VolN) + 0.2*VolumeTurb). - Terma anti-pengepaman menurunkan E semasa pemampatan ATR → Entropi akhir ∈ [0..1] dengan pelicinan EMA.
- Penanda:
-
- CRYSTAL — melintasi di bawah LowThr (perintah muncul: tren atau pengepaman pra-pemecahan).
- DISSOLVE — melintasi di atas HighThr (perintah pecah: kekacauan/kemerosotan tren).
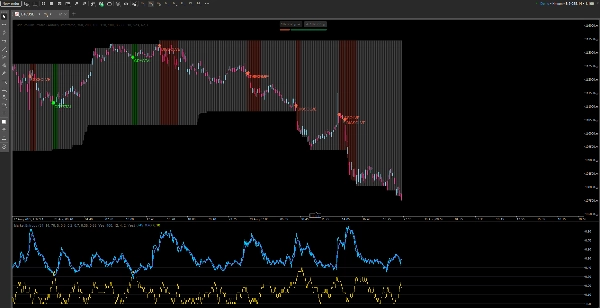
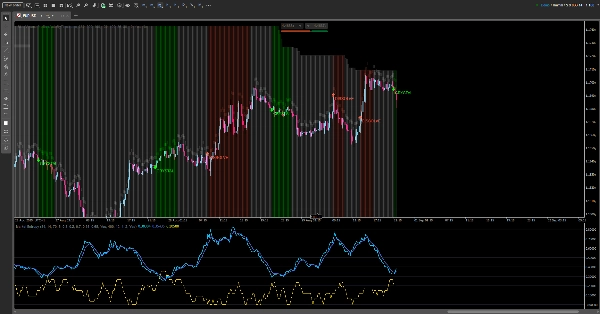
Apa yang anda lihat:
- Dalam panel: Entropi, Entropi(EMA), Trendness (DC), ambang Rendah/Tinggi, latar belakang zon.
- Pada carta (boleh dihidupkan/dimatikan): bar berwarna keadaan, pita nipis di atas paras tinggi, dan penanda CRYSTAL/DISSOLVE.
Panduan bacaan:
- E < LowThr → Perintah:
-
- dengan DC tinggi → tren yang tersusun;
- dengan ATR rendah → pengepaman (jangkaan pecahan).
- LowThr…HighThr → Peralihan: struktur terbentuk; tunggu penyelesaian.
- E > HighThr → Kekacauan: ketidakpastian / keletihan tren; elakkan kemasukan sambungan yang naif.
Buku panduan:
- Pengepaman → CRYSTAL → Pecah/Uji semula — dagangkan pecahan.
- Tren → DISSOLVE — keluarkan secara berperingkat atau ketatkan risiko.
Ringkasan
Profil indikator
Ulasan pelanggan
0.0
Ulasan: 0
Ulasan pelanggan
Belum ada ulasan untuk produk ini. Anda sudah mencuba produk tersebut? Jadilah yang pertama untuk berkongsi pendapat anda!
Perbincangan
Soalan Lazim
Produk yang tersedia melalui cTrader Store, termasuk bot dagangan, indikator dan plugin, disediakan oleh pembangun pihak ketiga dan diberikan akses untuk tujuan maklumat dan teknikal sahaja. cTrader Store bukan broker dan tidak memberikan nasihat pelaburan, syor peribadi atau sebarang jaminan prestasi masa hadapan.


![Logo "[Stellar Strategies] MARSI Signal Plotter"](https://cdn.ctrader.com/image/webp/7b2b8da6-8f8e-4646-8d4a-4710c516c01e_25567)


![Logo "Gaussian Channel [Iridio Capital]"](https://cdn.ctrader.com/image/webp/7c039209-5573-4a54-a072-f9528b503103_41960)


Harga
Sejak 26/05/2025
388.58M
Volum yang didagangkan
60.75K
Pip dimenangi
15
Jualan
1.41K
Pemasangan percuma