Penerangan
Penerangan
Penunjuk Pinescriptlabs Store: 🤖Pinescriptlabs Store cBots :
ICT Power of 3 (cBot) Gold & BTC BreakoutSession Pivots(baru)YieldShield"
SmartTrend Sokongan &
Garis Rintangan
Struktur Pasaran Dinamik
Analisis Titik Pusing
Fibonacci Linear
Regresi Pelbagai Jangka Masa
Bias Lilin Berbilang Tahap
Penjejak
Sokongan Auto dan
Garis Trend Rintangan
Semua Tahap Sokongan dan
Rintangan
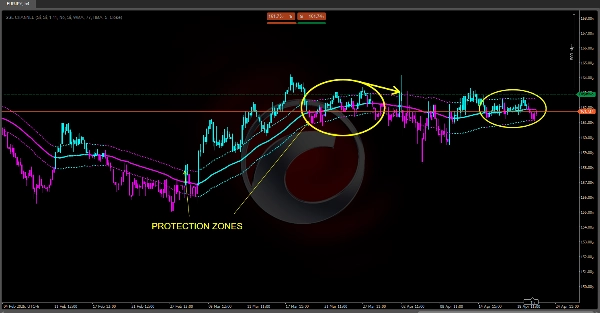
Saluran SSL Premium 🔍
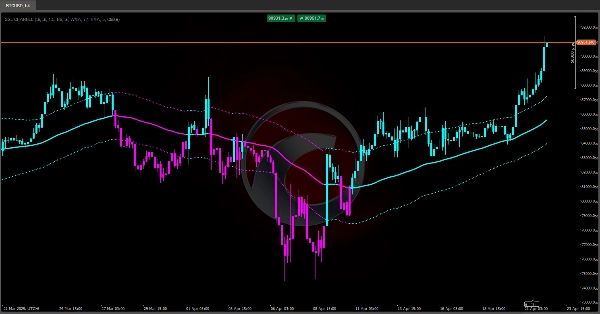
Menggabungkan pengesanan trend melalui purata bergerak, penilaian volatiliti dengan jalur berasaskan ATR, dan penapis jangka pendek (SSL) untuk menyediakan sistem analisis bersepadu. 💡 Kekuatan ia terletak pada kejelasan isyarat visual dan kebolehsuaian merentasi pasaran, manakala cabaran utama adalah meminimumkan kelewatan dan menapis pergerakan sisi. Dengan parameter yang betul, ia menjadi alat yang berkuasa untuk keputusan masuk/keluar dalam perdagangan. 🎯
1. Tujuan & Kegunaan Perdagangan 📊
• Pengesanan trend utama: Terima kasih kepada garis tengah (disebut "Garis Asas"), penunjuk menunjukkan arah dominan pasaran. 📈📉
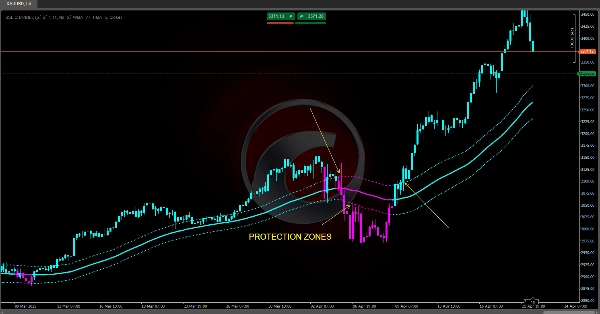
• Pengukuran volatiliti: Menggunakan julat purata (ATR), ia melaraskan dua jalur (atas/bawah Garis Asas) sebagai zon sokongan/rintangan dinamik. ⚡
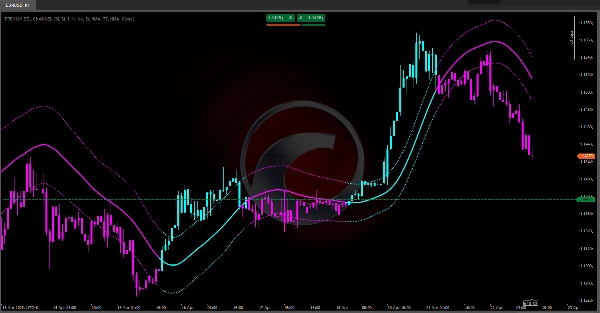
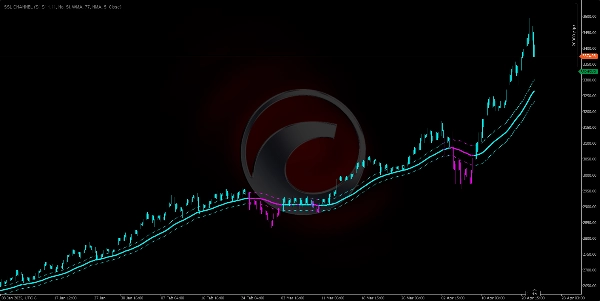
• Penapis hingar & peralihan bias: Saluran SSL (purata bergerak adaptif berdasarkan tinggi/rendah) mengenal pasti pembalikan jangka pendek untuk kemasukan/keluaran tepat. 🔄
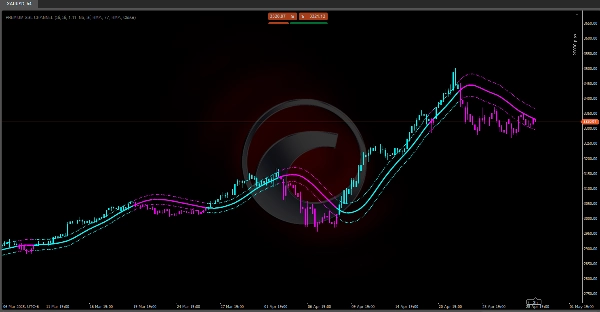
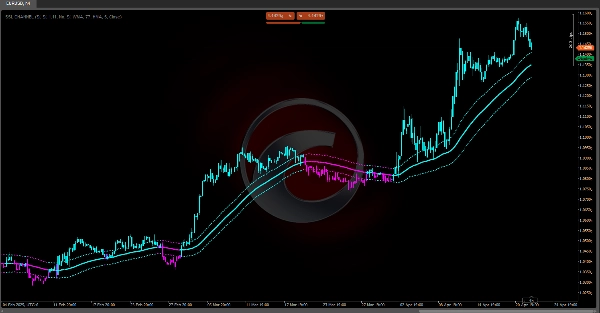
• Visualisasi intuitif: Mewarna bar harga dan garis mengikut bias (cyan = bullish, magenta = bearish) untuk tafsiran segera. 🎨
2. Komponen Teras & Logik ⚙️
2.1. Garis Tengah ("Garis Asas")
• Mengira purata bergerak harga (SMA, EMA, WMA, atau Hull) untuk menghaluskan hingar.
• Mewakili nilai purata pasaran, menunjukkan trend dominan:
- Harga di atas → Trend bullish. 🟢
- Harga di bawah → Trend bearish. 🔴
2.2. Julat Purata (ATR)
• Mengukur volatiliti pasaran sebenar dengan mengambil purata tinggi/rendah/tutup sebelumnya.
• ATR Lebih Tinggi = Lebih volatil; ATR Lebih Rendah = Pasaran lebih tenang. 🌊
2.3. Jalur Dinamik ("Up ATR" & "Down ATR")
• Up ATR = Garis Asas + (ATR × Pengganda)
• Down ATR = Garis Asas – (ATR × Pengganda)
• Bertindak sebagai saluran harga:
- Harga menyentuh jalur atas → Kekuatan bullish. 🚀
- Harga hampir jalur bawah → Momentum bearish. 🐻
2.4. Saluran SSL (Garis Isyarat Halus)
• Menggunakan purata bergerak pada tinggi/rendah secara berasingan.
• Logik arah:
- Tutup di atas MA tinggi → Bias bullish. ✅
- Tutup di bawah MA rendah → Bias bearish. ❌
- Di antara → Bias sebelumnya kekal.
• Bertindak sebagai penapis trend jangka pendek, mengesahkan/menyangkal Garis Asas. 🔄
3. Penjanaan Isyarat & Penggunaan Praktikal 🛠️
1. Pengesahan Trend
- Bullish Kuat: Harga > Up ATR. 🟢
- Bullish Sederhana: Up ATR > Harga > Garis Asas.
- Bearish Sederhana: Garis Asas > Harga > Down ATR.
- Bearish Kuat: Harga < Down ATR. 🔴
2. Penapis SSL
- Kemasukan: Masuk panjang hanya jika SSL di atas garisnya (atau pendek jika di bawah). ⬆⬇
- Keluar: Keluar sebahagian/penuh apabila SSL berbalik dan melintasi MA tinggi/rendah yang bertentangan. ✋
3. Pewarnaan Bar
- Bar harga bertukar cyan (bullish) atau magenta (bearish), diselaraskan dengan Garis Asas untuk bacaan pasaran yang pantas. 🎨
4. Parameter Boleh Laras & Impak ⚖️
• Tempoh Garis Asas: Lebih panjang = lebih halus tetapi lambat; lebih pendek = responsif tetapi bising. 🐢⚡
• Pengganda Jalur: Lebih tinggi = saluran lebih lebar (isyarat palsu kurang); lebih rendah = lebih ketat (lebih banyak isyarat, lebih banyak whipsaw). ↔️
• Jenis MA (SMA/EMA/WMA/HMA): Mempengaruhi pemberat harga terkini vs. sejarah. 📅
• Tempoh & Jenis SSL: Menentukan kepekaan penapis jangka pendek. 🎚️
Ringkasan
A key feature is the SSL (Signal-Smooth-Line) channel, an adaptive moving average applied separately to highs and lows, serving as a short-term filter to detect reversals and refine entry and exit points. The indicator visually enhances interpretation by coloring price bars and lines cyan for bullish bias and magenta for bearish bias.
Users can configure parameters including the Baseline period (affecting smoothness and responsiveness), band multiplier (channel width), moving average type (SMA, EMA, WMA, or Hull), and SSL period/type (filter sensitivity). Signal generation involves trend strength classification based on price position relative to ATR bands and SSL-based entry/exit rules.
This tool supports various markets including commodities, cryptocurrencies (e.g., BTCUSD), and symbols like XAUUSD, providing clear, adaptable signals for precise trading decisions.
Ulasan pelanggan
5 | 100 % | |
4 | 0 % | |
3 | 0 % | |
2 | 0 % | |
1 | 0 % |