
Penerangan
Penunjuk Kedai Pinescriptlabs: Pinescriptlabs Kedai cBots : (cBot) Gold & BTC BreakoutSession Pivots(baru)
Struktur Pasaran Lanjutan: Bos, Choch, SwinLevels, Blok Pesanan, Pencari Struktur Pasaran & Kecairan (Baru)
Algoritma Pintar Jejak (baru)
Ramalan Berdasarkan Linreg & ATR
Sokongan & Tren Pintar
Rintangan
Garis
Dinamik
Analisis Struktur Pasaran
of
Turning
Points
Fibonacci
Linear
Regression
Berbilang jangka masa
Berbilang Tahap
Bias Lilin
Penjejak
Auto
Sokongan dan
Rintangan
Tren
Garis
Semua
Sokongan dan
Rintangan
Tahap
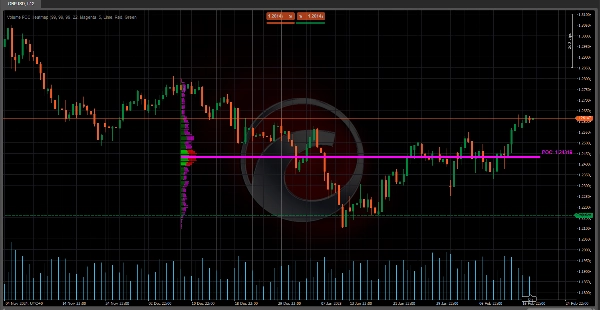
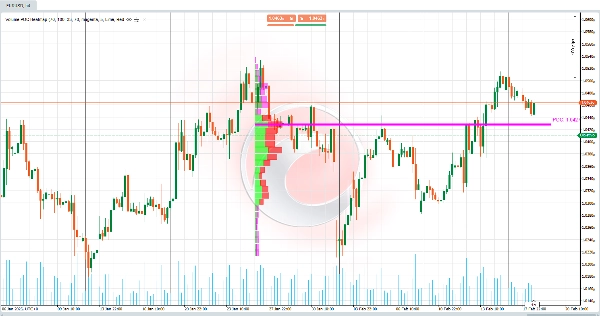
🔥 Peta Haba Volume POC 🔥
Penunjuk ini adalah Profil Volume yang memaparkan taburan jumlah dagangan merentasi tahap harga yang berbeza dalam tempoh tertentu. Matlamat utamanya adalah untuk mengenal pasti zon sokongan/rintangan utama dan kawasan di mana pasaran menunjukkan minat paling tinggi (aktiviti beli/jual yang tinggi). Ia sangat berguna untuk:
- Mengesan Titik Kawalan (POC) 🎯
Tahap harga dengan jumlah tertinggi, bertindak sebagai magnet untuk tindakan harga. - Memvisualisasikan Kawasan Nilai (VA)
Zon di mana peratusan tertentu daripada jumlah keseluruhan tumpuannya (contohnya, 70%), menunjukkan keseimbangan antara pembeli dan penjual. - Membezakan Volume Bullish dan Bearish 📈📉
Menunjukkan di mana kuasa beli berbanding tekanan jual terkumpul.
🧠 Logik Utama & Pengiraan 🔢
- Pembahagian Julat Harga 📏
-
- Julat harga (dari yang terendah ke yang tertinggi dalam B Bar terakhir) dibahagikan kepada Sel Volume (CNum) .
Contoh: Jika CNum = 33 , julat dibahagikan kepada 33 tahap sama jarak.
- Julat harga (dari yang terendah ke yang tertinggi dalam B Bar terakhir) dibahagikan kepada Sel Volume (CNum) .
- Taburan Volume mengikut Tahap 📊
-
- Untuk setiap bar dalam data sejarah:
-
- Volume yang berkaitan dengan badan (perbezaan antara buka dan tutup) dan sumbu (tertinggi dan terendah) dikira.
- Volume diagihkan secara berkadar merentasi sel harga yang dilintasi oleh bar tersebut.
Contoh: Jika bar hijau (bullish) meliputi 3 sel, volume diberikan terutamanya kepada sel tersebut sebagai "volume bullish."
- Pengiraan Titik Kawalan (POC) 🎯
-
- POC adalah sel dengan jumlah terkumpul tertinggi, mewakili harga di mana terdapat persetujuan paling banyak antara pembeli dan penjual.
- Pengiraan Kawasan Nilai (VA) 🔄
-
- Berkembang dari POC ke atas/bawah sehingga merangkumi % tertentu daripada jumlah volume (contohnya, 70%).
Contoh: Jika VA berada antara 100 hingga 105 , bermakna 70% volume didagangkan dalam julat itu.
- Berkembang dari POC ke atas/bawah sehingga merangkumi % tertentu daripada jumlah volume (contohnya, 70%).
- Normalisasi Visual 🖼️
-
- Volume diskalakan menggunakan Faktor Skala untuk menyesuaikan lebar bar pada carta, memudahkan visualisasi.
🛠️ Kunci Peta Haba Volume POC 💡
- Kekurangan Konteks dalam Penunjuk Volume Tradisional 🤔
Penunjuk volume klasik (seperti volume bar demi bar) tidak menunjukkan di mana volume didagangkan. Penunjuk ini memetakan volume mengikut tahap harga, menyelesaikan isu tersebut. - Pengenalpastian Sokongan/Rintangan Organik 🚀
Zon dengan volume tinggi bertindak sebagai sokongan/rintangan dinamik, lebih boleh dipercayai daripada garis statik. - Pengesanan Ketidakseimbangan ⚖️
Kawasan dengan volume bullish atau bearish yang dominan menandakan potensi pecahan atau pembalikan.
💡 Penggunaan Praktikal dalam Perdagangan 📈
- POC sebagai Zon Minat 🎯
-
- Jika harga menghampiri POC, jangka tindak balas seperti pantulan atau pengukuhan.
- Kawasan Nilai (VA) sebagai Zon Keseimbangan 🔄
-
- Jika harga berada di luar VA, ia cenderung kembali ke VA (kesan magnetik).
- Jika harga berada dalam VA, ia mungkin menunjukkan pengukuhan.
- Volume Bullish/Bearish sebagai Pengesahan 🔍
-
- Lonjakan volume bullish di rintangan menunjukkan potensi pecahan.
- Volume bearish tinggi di sokongan menunjukkan kemungkinan penurunan.
🌟 Contoh 📊
Parameter Digunakan (Boleh Dilihat & Dikonfigurasi oleh Pengguna):
- Bars Back = 55 → Bilangan bar sejarah yang dianalisis.
- Sel Volume = 33 → Bilangan pembahagian/sel dalam julat harga.
- Peratusan Volume Kawasan Nilai = 70 → Peratusan volume yang menentukan Kawasan Nilai.
Situasi:
- Harga menembusi tahap sokongan teknikal, tetapi volume di zon itu rendah (mengikut profil).
- Kemudian, harga kembali ke Kawasan Nilai (VA) yang ditentukan oleh 70% daripada jumlah volume.
Interpretasi:
- Pecahan itu palsu (kerana volume rendah di zon pecahan).
- Pasaran berusaha untuk menyeimbangkan semula dalam Kawasan Nilai , di mana terdapat aktiviti lebih tinggi (ketumpatan volume tinggi).
Tindakan:
- Cari peluang membeli berhampiran had bawah VA atau POC, kerana ini adalah zon minat tinggi bagi peserta pasaran.
Ringkasan
Key functionalities include:
- Division of the price range into multiple volume cells for detailed volume mapping.
- Calculation of POC as the volume consensus price.
- Determination of the Value Area around the POC.
- Visual normalization of volume bars for clearer chart representation.
This tool addresses the limitation of traditional volume indicators by showing where volume was traded rather than just total volume per bar. It helps identify dynamic support and resistance zones based on volume concentration and detects volume imbalances that may signal potential breakouts or reversals. Traders can use it to anticipate price reactions near the POC and VA, aiding in decision-making for entries and exits. Configurable parameters include the number of historical bars analyzed, volume cells, and the percentage defining the Value Area.
Ulasan pelanggan
5 | 100 % | |
4 | 0 % | |
3 | 0 % | |
2 | 0 % | |
1 | 0 % |