
Tracking Performance by Quantara
Wskaźnik
29 pobrania
Wersja 1.0, Feb 2026
Windows, Mac
Opis
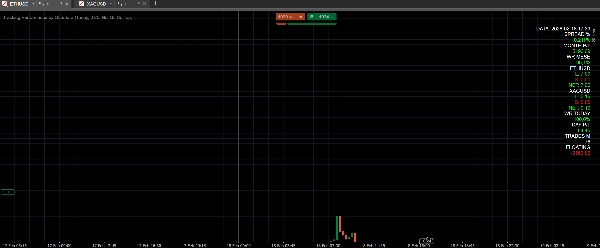
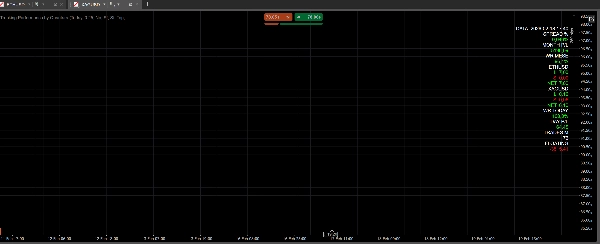
Tracking Perfromance by Quantara to wskaźnik na pulpicie wyświetlający metryki wydajności w czasie rzeczywistym oraz ekspozycję na poszczególne aktywa.
Pokazuje: miesięczny i dzienny P/L, miesięczną i dzienną skuteczność, miesięczną liczbę transakcji, pływający P/L, spread w procentach oraz long/short/net dla każdego otwartego aktywa.
Wszystkie wartości są kodowane kolorami dla szybkiego odczytu (pozytywny/negatywny P/L, progi skuteczności, long zielony, short czerwony).
Co oblicza/wyświetla
- Spread % (z różnymi progami dla metali i kryptowalut)
- Miesięczny i dzienny P/L
- Miesięczna i dzienna skuteczność
- Miesięczna liczba transakcji
- Pływający P/L
- Ekspozycja na poszczególne aktywa (long / short / net)
Zalecane instrumenty/ramy czasowe
- Działa na dowolnym instrumencie i dowolnej ramie czasowej
- Sugerowane na głównych wykresach (M15–H4) do codziennego monitoringu
Jak używać
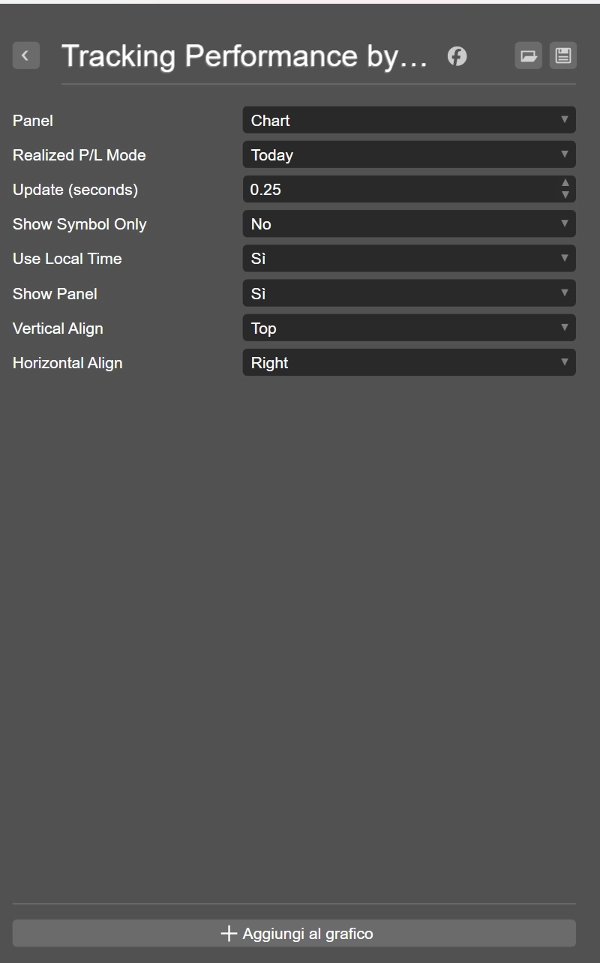
- Dodaj wskaźnik do wykresu
- Ustaw interwał aktualizacji (Update seconds)
- Użyj Show Panel, aby przełączać widoczność
- Użyj „Show Symbol Only”, aby filtrować do symbolu wykresu
- Użyj „Use Local Time”, aby zastosować lokalne filtry czasowe
Kluczowe parametry
- Update (seconds): częstotliwość odświeżania
- Show Symbol Only: wyświetlaj tylko symbol wykresu
- Use Local Time: używaj lokalnego czasu dla filtrów
- Show Panel: pokaż/ukryj panel
- Vertical/Horizontal Align: umiejscowienie panelu
Przypadki użycia
- Szybkie sprawdzenie ekspozycji netto na aktywo
- Codzienne i miesięczne śledzenie wyników
- Monitorowanie skuteczności dla jakości operacyjnej
- Monitorowanie spreadu % dla metali i kryptowalut
Zastrzeżenie
Handel wiąże się z ryzykiem. Wyniki z przeszłości nie gwarantują wyników w przyszłości.
Podsumowanie
Profil wskaźnika
Opinie klientów
0.0
Opinie: 0
Opinie klientów
Ten produkt nie ma jeszcze opinii. Wypróbowałeś(-aś) go już? Bądź pierwszy(-a) i powiedz o tym innym!
Dyskusja
Częste pytania
Forex
Indices
Commodities
Crypto
Stocks
Produkty dostępne za pośrednictwem cTrader Store, w tym boty handlowe, wskaźniki i wtyczki, dostarczane są przez deweloperów zewnętrznych i udostępniane wyłącznie w celach informacyjnych oraz w celu zapewnienia dostępu technicznego. cTrader Store nie jest brokerem i nie zapewnia doradztwa inwestycyjnego, nie udziela spersonalizowanych rekomendacji ani nie gwarantuje przyszłych wyników.


Cena
Od 29/01/2026
29
Bezpłatne instalacje