
Support Resistance Zones
Gösterge
1.81K i̇ndirmeler
Sürüm 1.0, Apr 2025
Windows, Mac
5.0
Değerlendirmeler: 4
Açıklama
Özet
YZ özeti
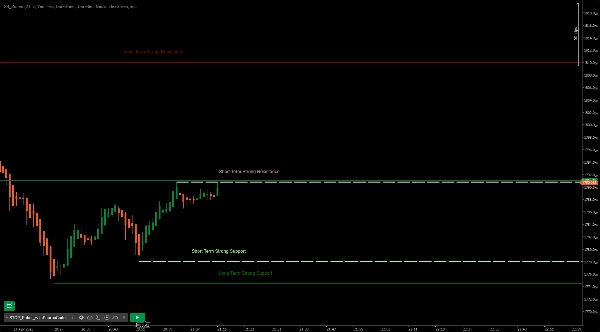
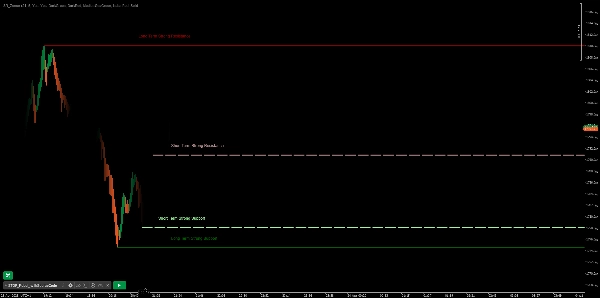
Support Resistance Zones is a trading indicator designed to identify key support and resistance levels on price charts. It distinguishes between short and long support/resistance zones and categorizes them as strong or minor resistance areas. This tool helps traders visualize critical price levels where market reversals or consolidations may occur, aiding in technical analysis and decision-making.
Gösterge profili
Müşteri değerlendirmeleri
5.0
Değerlendirmeler: 4
5 | 100 % | |
4 | 0 % | |
3 | 0 % | |
2 | 0 % | |
1 | 0 % |
Müşteri değerlendirmeleri
December 21, 2025
December 18, 2025
100% Amazing tool for a beginner like me who makes 90% Wins and 90% Losses, Now just Wins and losses because I get bored - Thank YOU so much for this tool.
July 14, 2025
Pros: Automatically detects support and resistance zones. Customizable and visually clear. Works across all timeframes. Cons: No alerts or tooltips. Lacks volume-based filtering and template saving. Needs confirmation tools for reliable signals.
Tartışma
SSS
cTrader Store üzerinden erişilebilen işlem botları, göstergeler ve eklentiler gibi ürünler, üçüncü taraf sağlayıcılar tarafından sağlanır ve yalnızca bilgilendirme ve teknik erişim amaçlarıyla sunulur. cTrader Store bir broker değildir ve yatırım tavsiyesi, kişisel öneriler vermez veya gelecekteki performansı garanti etmez.


Fiyat
Başlangıç 09/01/2025
11.78K
Ücretsiz yüklemeler