
คำอธิบาย
═══════════════════════════════════════════════════════════════
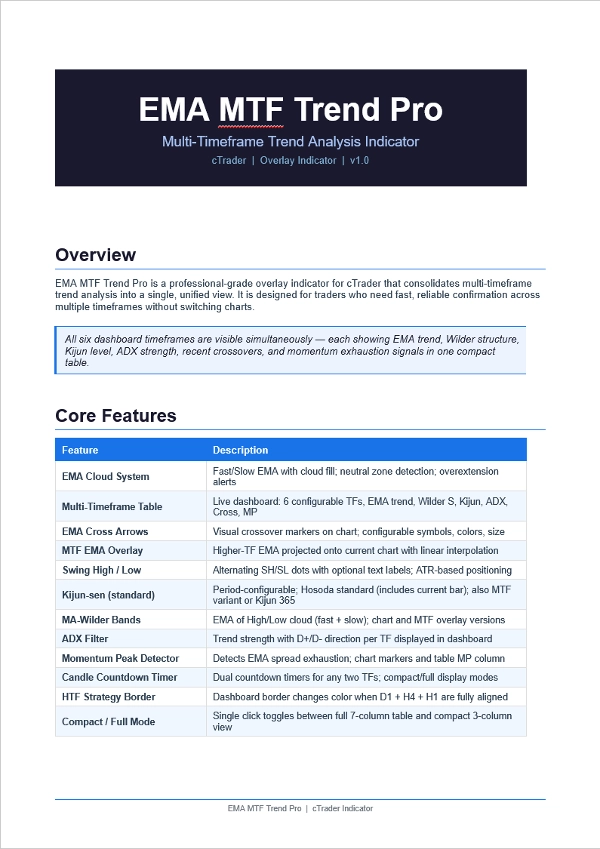
EMA MTF TREND PRO — ตัวบ่งชี้วิเคราะห์แนวโน้มหลายกรอบเวลา
ตัวบ่งชี้ซ้อนทับ cTrader
═══════════════════════════════════════════════════════════════
ดูภาพรวมแนวโน้มเต็มรูปแบบใน 6 กรอบเวลา — ในตารางเดียว,
บนชาร์ตเดียว โดยไม่ต้องสลับหน้าต่าง
───────────────────────────────────────────────────────────────
สิ่งที่มันทำ
───────────────────────────────────────────────────────────────
EMA MTF Trend Pro รวมทิศทางแนวโน้ม EMA โครงสร้างช่องวายล์เดอร์
ระดับ Kijun-sen ความแข็งแกร่ง ADX สัญญาณครอสโอเวอร์
และการหมดแรงโมเมนตัมไว้ในแดชบอร์ดสดเดียว
แต่ละแถวในตารางคือกรอบเวลาที่แตกต่างกัน แต่ละคอลัมน์
ตอบคำถามที่แตกต่างกันเกี่ยวกับกรอบเวลานั้น เพียงแค่ดู
ก็รู้ว่ากรอบเวลาต่าง ๆ เห็นพ้องกันหรือไม่ — และปลอดภัยที่จะ
เข้าทำรายการหรือไม่
───────────────────────────────────────────────────────────────
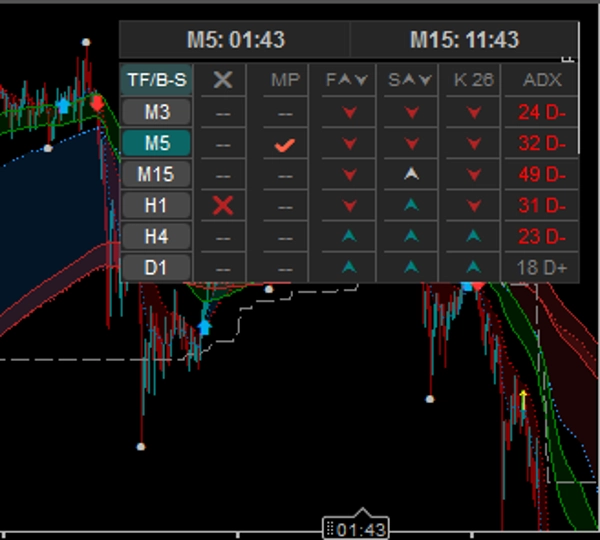
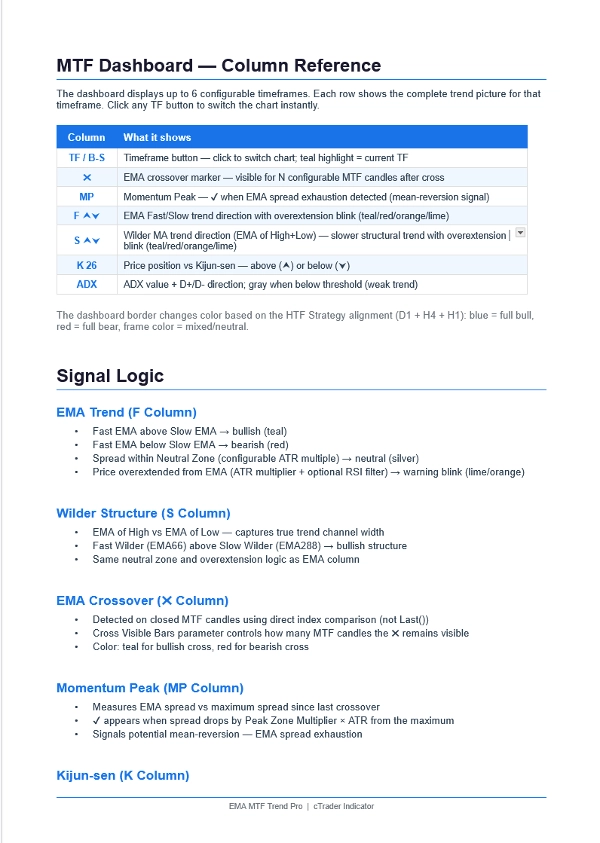
แดชบอร์ด — 6 กรอบเวลา × 7 คอลัมน์
───────────────────────────────────────────────────────────────
คอลัมน์ สิ่งที่แสดง
──────── ──────────────────────────────────────────────────
ปุ่ม TF/B-S กรอบเวลา — คลิกเพื่อเปลี่ยนชาร์ตทันที
ไฮไลต์สีเขียวเทอควอยซ์ = กรอบเวลาที่แสดงอยู่ในขณะนี้
✖ ครอสโอเวอร์ EMA — มองเห็นได้สำหรับแท่งเทียนที่ตั้งค่าได้ N แท่ง
สีเขียวเทอควอยซ์ = ครอสขาขึ้น | สีแดง = ครอสขาลง
MP จุดสูงสุดโมเมนตัม — ✔ เมื่อการกระจาย EMA หมดแรง
สัญญาณเตือนการกลับตัวเฉลี่ย
F ⮝⮟ ทิศทางแนวโน้ม EMA เร็ว vs ช้า
สีเขียวเทอควอยซ์ = ขาขึ้น | สีแดง = ขาลง | สีเงิน = เป็นกลาง
กระพริบเมื่อราคายืดเกินจาก EMA
S ⮝⮟ โครงสร้าง MA วายล์เดอร์ (EMA ของสูง/ต่ำ)
ตัวกรองแนวโน้มที่ช้ากว่าและมีโครงสร้างมากขึ้น
K 26 ราคาเทียบกับ Kijun-sen
⮝ = ราคาสูงกว่า (แนวรับ) | ⮟ = ต่ำกว่า (แนวต้าน)
ADX ความแข็งแกร่งแนวโน้ม + ทิศทาง D+/D-
สีเทา = ตลาดอ่อนแอ/แกว่งตัว (ต่ำกว่าค่ากำหนด)
───────────────────────────────────────────────────────────────
คุณสมบัติ
───────────────────────────────────────────────────────────────
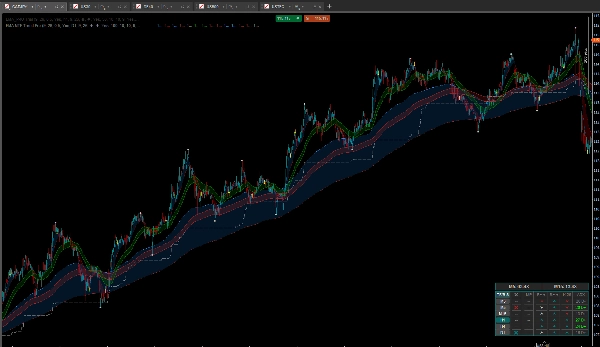
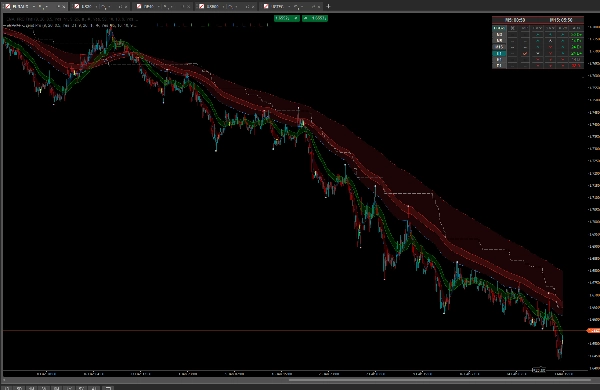
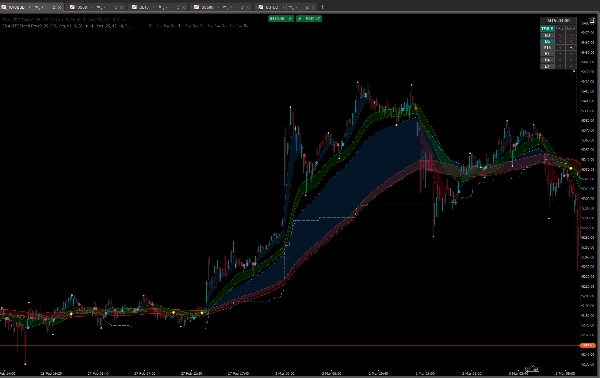
ระบบเมฆ EMA
• EMA เร็ว + ช้า พร้อมการเติมสีเมฆ
• การตรวจจับโซนเป็นกลาง (ตัวคูณ ATR ที่ตั้งค่าได้)
• การแจ้งเตือนการยืดเกินด้วยตัวกรอง RSI
การซ้อนทับ EMA หลายกรอบเวลา
• โปรเจกต์ EMA ของกรอบเวลาที่สูงกว่าบนชาร์ตปัจจุบัน
• การประมาณเชิงเส้น — เส้นเรียบ ไม่มีขั้นบันได
• ลูกศรครอสโอเวอร์พร้อมสัญลักษณ์และสีที่ตั้งค่าได้
• ซ่อนลูกศรซ้อนทับอัตโนมัติเมื่อเลือกกรอบเวลาที่สูงกว่า
ในแดชบอร์ด (ป้องกันความรกทางสายตา)
จุดสูงสุดและต่ำสุดสวิง
• จุด SH / SL สลับกัน — ไม่มีจุดสูงสุดซ้ำติดต่อกัน
• ป้ายข้อความ SH / SL ตัวเลือกพร้อมตำแหน่งตาม ATR
• ขนาดจุด ป้าย ขนาด สี ตั้งค่าได้
• สวิตช์เปิด/ปิดเดียวสำหรับการแสดงสวิงทั้งหมด
Kijun-sen
• คำนิยาม Hosoda มาตรฐาน (ตรงกับ TradingView / MT4)
• กำหนดช่วงเวลาได้
• มีให้เป็นเส้นซ้อนทับ MTF บนชาร์ต
แถบ MA-Wilder
• EMA ของสูงและ EMA ของต่ำ — สร้างช่องแนวโน้ม
• แถบเร็ว (EMA66) + แถบช้า (EMA288)
• มีให้บนชาร์ตและเป็นซ้อนทับ MTF
ขอบกลยุทธ์ HTF
• ขอบแดชบอร์ดเปลี่ยนเป็นสีเขียวเทอควอยซ์เมื่อ D1 + H4 + H1
ทั้งหมดเป็นขาขึ้น (EMA + Wilder สอดคล้องกัน)
• เปลี่ยนเป็นสีแดงเมื่อทั้งสามเป็นขาลง
• ยืนยันด้วยภาพทันทีของการจัดแนวหลายกรอบเวลาเต็มรูปแบบ
ตัวจับเวลานับถอยหลังแท่งเทียน
• ตัวจับเวลาคู่ — กรอบเวลาใดก็ได้สองกรอบ
• ตัวจับเวลาที่สองสามารถติดตามกรอบเวลาชาร์ตปัจจุบัน
• รูปแบบกะทัดรัดในโหมดคอลัมน์เดียว
โหมดกะทัดรัด / เต็ม
• คลิกหัวข้อ TF/B-S เพื่อสลับ
• โหมดเต็ม: 7 คอลัมน์ (สัญญาณทั้งหมด)
• โหมดกะทัดรัด: 3 คอลัมน์ (TF, EMA, Wilder) — ใช้พื้นที่น้อย
───────────────────────────────────────────────────────────────
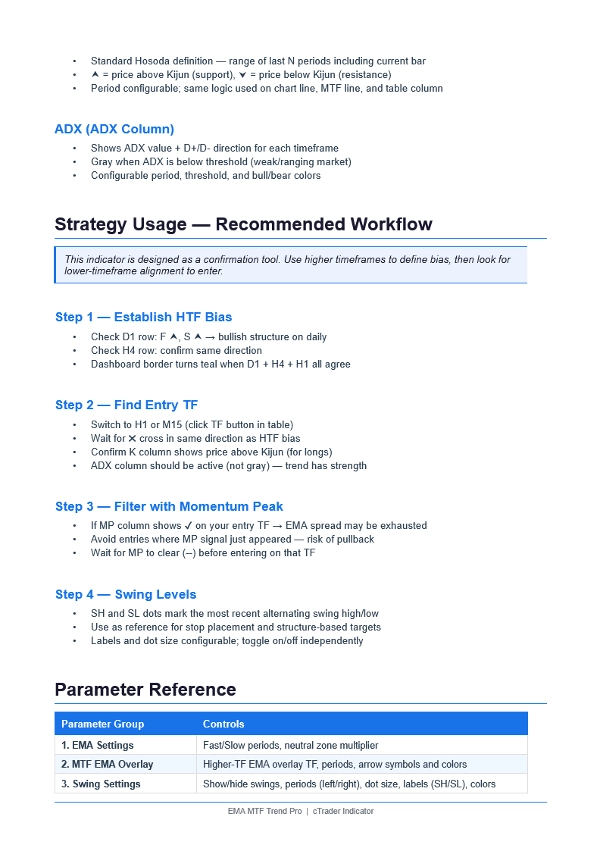
กลยุทธ์ — วิธีใช้
───────────────────────────────────────────────────────────────
ขั้นตอนที่ 1 — กำหนดแนวโน้ม (กรอบเวลาสูงกว่า)
• แถว D1: F ⮝ + S ⮝ = โครงสร้างรายวันขาขึ้น
• แถว H4: ทิศทางเดียวกัน = ยืนยันแนวโน้ม
• ขอบแดชบอร์ดเปลี่ยนเป็นสีเขียวเทอควอยซ์ = D1 + H4 + H1 เห็นพ้องกัน
ขั้นตอนที่ 2 — หาจุดเข้า (กรอบเวลาต่ำกว่า)
• คลิก H1 หรือ M15 ในตารางเพื่อเปลี่ยนชาร์ต
• รอสัญลักษณ์ ✖ ครอสในทิศทางเดียวกับแนวโน้ม HTF
• คอลัมน์ K แสดง ⮝ (ราคาสูงกว่า Kijun) สำหรับการซื้อ
• คอลัมน์ ADX ทำงาน ไม่ใช่สีเทา (แนวโน้มมีความแข็งแกร่ง)
ขั้นตอนที่ 3 — กรองด้วยจุดสูงสุดโมเมนตัม
• คอลัมน์ MP แสดง ✔ → การกระจาย EMA หมดแรง → หลีกเลี่ยงการเข้า
• รอให้ MP หายไป (--) ก่อนเข้า
• ใช้กับกรอบเวลาต่ำกว่าเพื่อหลีกเลี่ยงการเข้าในจุดสุดขีดของ EMA
ขั้นตอนที่ 4 — ใช้ระดับสวิง
• จุด SH = จุดสูงสุดสวิงล่าสุด (แนวต้าน / อ้างอิงหยุด)
• จุด SL = จุดต่ำสุดสวิงล่าสุด (แนวรับ / อ้างอิงเป้าหมาย)
• จุดสลับกัน — มีเพียงหนึ่งสูง หนึ่งต่ำในแต่ละครั้ง
───────────────────────────────────────────────────────────────
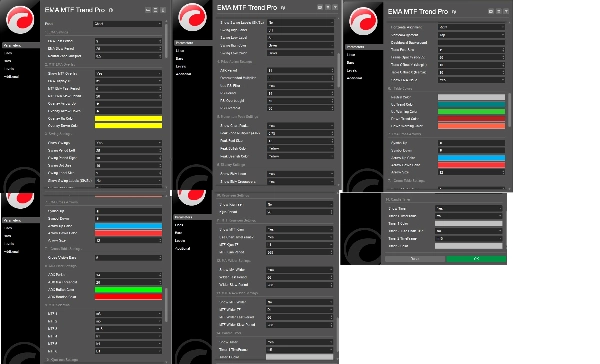
กลุ่มพารามิเตอร์
───────────────────────────────────────────────────────────────
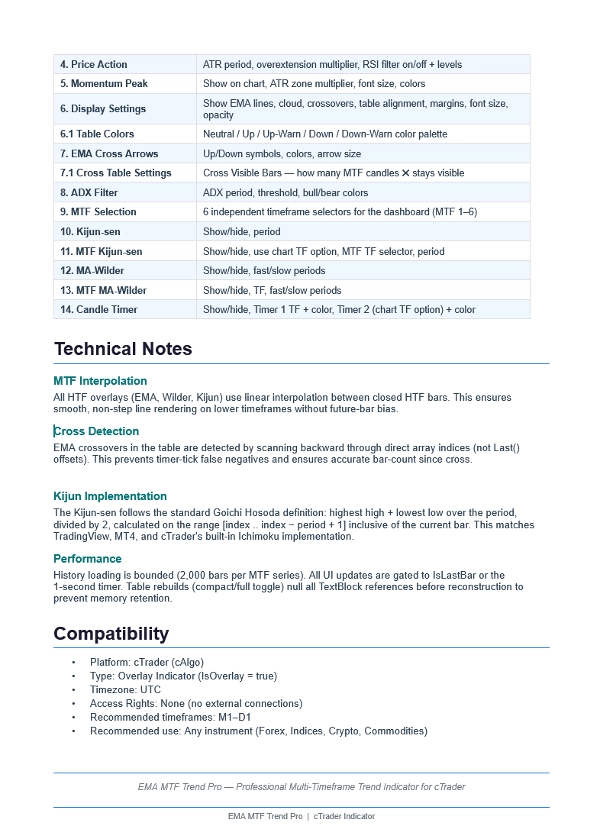
1. การตั้งค่า EMA — ช่วงเร็ว/ช้า, โซนเป็นกลาง
2. การซ้อนทับ EMA MTF — TF, ช่วงเวลา, รูปแบบลูกศร
3. การตั้งค่าสวิง — แสดง/ซ่อน, ช่วงเวลา, ป้าย, สี
4. การเคลื่อนไหวราคา — ATR, การยืดเกิน, ตัวกรอง RSI
5. จุดสูงสุดโมเมนตัม — ตัวคูณโซน, ฟอนต์, สี
6. การตั้งค่าการแสดงผล — เส้น, เมฆ, รูปแบบตาราง
6.1 สีตาราง — ควบคุมพาเลตสีเต็มรูปแบบ
7. ลูกศรครอส EMA — สัญลักษณ์, สี, ขนาด
7.1 การตั้งค่าตารางครอส — แถบที่มองเห็นครอส (แท่งเทียน N)
8. ตัวกรอง ADX — ช่วงเวลา, ค่ากำหนด, สี
9. การเลือก MTF — ตัวเลือก TF อิสระ 6 ตัว
10. Kijun-sen — แสดง/ซ่อน, ช่วงเวลา
11. Kijun-sen MTF — TF, ช่วงเวลา, ตัวเลือก TF ชาร์ต
12. MA-Wilder — แสดง/ซ่อน, ช่วงเร็ว/ช้า
13. MA-Wilder MTF — TF, ช่วงเร็ว/ช้า
14. ตัวจับเวลาแท่งเทียน — TF, สี, ตัวเลือก TF ชาร์ต
───────────────────────────────────────────────────────────────
สรุป
รีวิวจากลูกค้า
5 | 0 % | |
4 | 100 % | |
3 | 0 % | |
2 | 0 % | |
1 | 0 % |


