
Deskripsi
Ikhtisar
Berhenti menebak arah pasar. EMA MTF Cloud & Dashboard adalah seperangkat alat mengikuti tren yang komprehensif yang dirancang untuk scalper dan trader harian. Ini menggabungkan kelancaran Exponential Moving Averages dengan kekuatan analisis Multi-Timeframe, semuanya dalam satu antarmuka grafik yang bersih.
Berbeda dengan indikator standar, alat ini mencakup logika Smart Neutral Zone untuk menyaring pasar yang bergejolak, menyelamatkan Anda dari sinyal palsu selama periode datar.
Fitur Utama
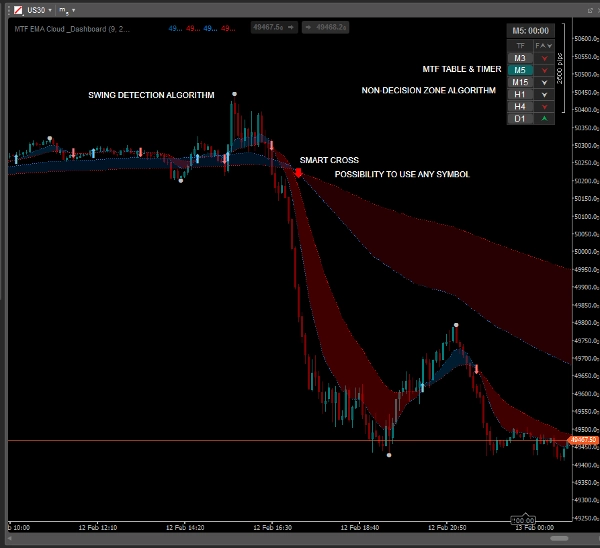
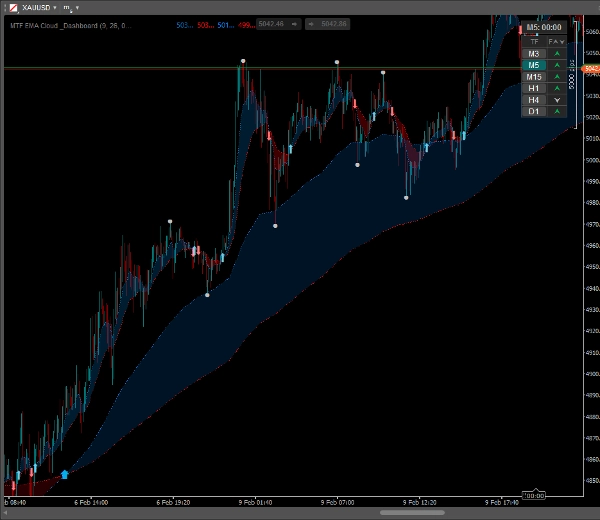
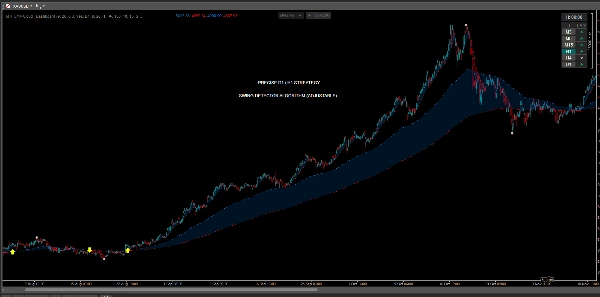
✅ Dynamic EMA Clouds
Visualisasikan tren secara instan. Ruang antara EMA Cepat dan Lambat diisi dengan awan semi-transparan, memudahkan untuk mengidentifikasi kekuatan tren dan zona support/resistance potensial.
✅ MTF Overlay (Multi-Timeframe)
Lihat "Gambaran Besar" tanpa mengganti grafik. Tampilkan EMA timeframe lebih tinggi (misalnya, H1) langsung di grafik timeframe lebih rendah Anda (misalnya, M5).
- Menyertakan panah crossover terpisah untuk tren MTF!
✅ Smart Trend Dashboard
Tabel ringkas yang dapat diklik yang menunjukkan status tren untuk 6 timeframe (M3 hingga Harian).
- Logika Zona Netral: Dashboard mendeteksi pasar datar (konsolidasi) dan menandainya dengan warna abu-abu/perak, membantu Anda menghindari perdagangan yang buruk.
- Interaktif: Klik pada tombol Timeframe mana pun di tabel untuk langsung mengganti grafik.
✅ Swing High / Swing Low Points
Secara otomatis menandai puncak dan dasar lokal yang signifikan. Sempurna untuk menempatkan Stop Loss atau mengidentifikasi level Take Profit berdasarkan struktur harga terbaru.
✅ Visual Crossover Signals
Panah yang jelas dan dapat disesuaikan muncul tepat saat EMA Cepat melintasi EMA Lambat.
- Sesuaikan warna, ukuran, dan gaya panah.
✅ Candle Timer
Timer hitung mundur bawaan menunjukkan dengan tepat berapa banyak waktu tersisa hingga lilin ditutup, penting untuk menentukan waktu masuk Anda.
Cara Berdagang (Contoh Strategi)
- Periksa Dashboard: Pastikan timeframe lebih tinggi (misalnya, H1, H4) cocok (Hijau/Merah). Hindari berdagang jika menunjukkan "Netral" (Abu-abu).
- Tunggu Sinyal: Cari panah crossover sesuai arah tren utama.
- Konfirmasi dengan Price Action: Gunakan titik "Swing High/Low" untuk mengonfirmasi struktur pasar.
- Masuk & Kelola: Masuk saat lilin ditutup. Gunakan EMA Cloud sebagai support dinamis untuk mengelola trailing stop loss Anda.
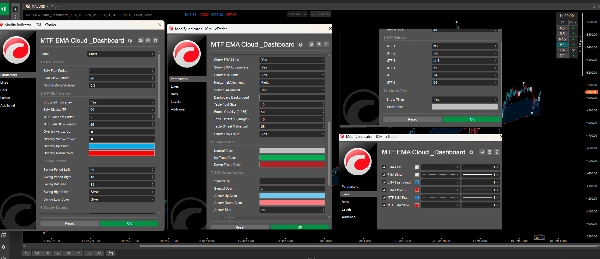
Kustomisasi
Indikator ini sangat dapat disesuaikan agar sesuai dengan gaya Anda:
- Sesuaikan periode EMA untuk mode saat ini dan MTF.
- Ubah warna untuk Clouds, Panah, Swings, dan Dashboard.
- Konfigurasikan posisi dan transparansi Dashboard.
- Nyalakan/matikan fitur apa pun secara independen.
Ringkasan
A smart dashboard displays trend status across six timeframes (from 3 minutes to daily), incorporating a neutral zone logic that highlights flat or consolidating markets to help avoid false signals. The dashboard is interactive, enabling quick chart switching by clicking on timeframe buttons. The tool automatically marks swing high and low points to assist in setting stop loss and take profit levels based on recent price structure. Visual crossover arrows signal EMA fast and slow line crossovers, with customizable colors and styles. Additionally, a candle timer shows the remaining time until the current candle closes, aiding precise trade timing.
The indicator is highly customizable, allowing adjustments to EMA periods, colors, dashboard position, transparency, and feature toggling to fit individual trading styles. It supports markets including Forex, Crypto, and commodities like gold (XAUUSD), and is tagged for use with symbols such as BTCUSD and USDJPY.
Ulasan pelanggan
5 | 0 % | |
4 | 100 % | |
3 | 0 % | |
2 | 0 % | |
1 | 0 % |


