present
Sign up and get $50 off your first purchase
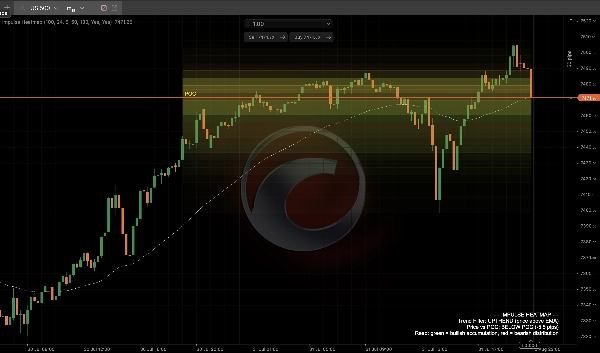
Trading product for Impulse Heatmap Indicator EMA Key Levels, image 1
Impulse Heatmap
Indicator
Version 1.0, Aug 2026
Windows, Mac
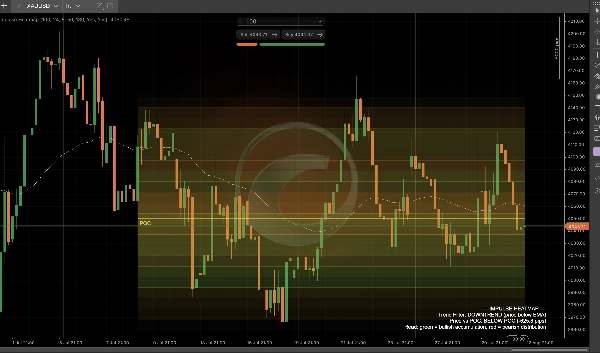
Trading product for Impulse Heatmap Indicator EMA Key Levels, image 2
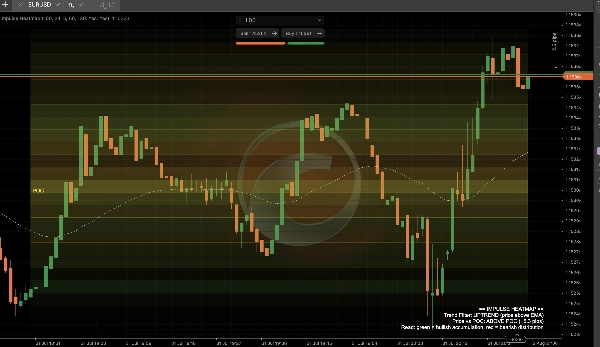
Trading product for Impulse Heatmap Indicator EMA Key Levels, image 3
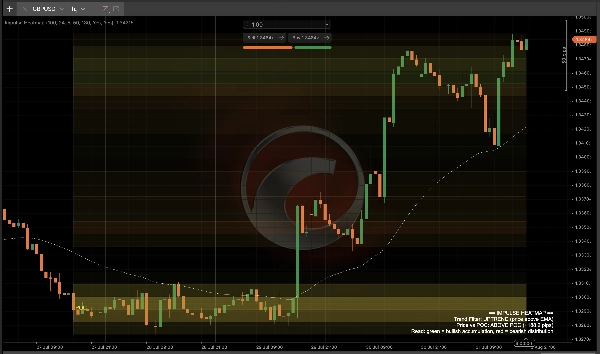
Trading product for Impulse Heatmap Indicator EMA Key Levels, image 4
Trading product for Impulse Heatmap Indicator EMA Key Levels, image 5
Since 07/05/2026
5
Sales
63
Free installs

Description

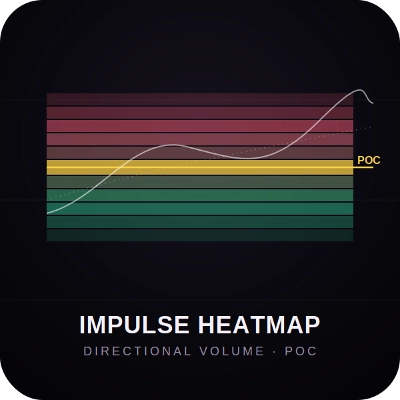
Volume heatmaps are everywhere right now, but almost all of them show the same thing: intensity only, one colour, no sense of whether that volume was buying or selling. Impulse Heatmap adds the missing piece — every price zone is colour-blended by direction, not just density, so you can tell accumulation from distribution at a glance.

What it analyses: tick volume across a rolling lookback window, distributed into price bins the same way a standard volume profile works — except each bin's colour is a blend of how much of that volume came from bullish-closing candles versus bearish-closing candles at that price. A zone that's mostly bullish volume glows green (accumulation); a zone that's mostly bearish volume glows red (distribution); mixed zones sit somewhere in between.

How to read it:

  • Bright, saturated zones = high volume concentration — these are the price levels the market has spent the most time and size at.
  • Green-tinted zones = that price level built up mostly on bullish pressure — a potential support/accumulation area.
  • Red-tinted zones = that price level built up mostly on bearish pressure — a potential resistance/distribution area.
  • The gold POC line tracks the smoothed centre of gravity of volume — where the real "fair value" magnet currently sits, without the jumpiness of a raw point-of-control calculation.
  • The white trend filter EMA gives you context: is the current heat zone backing the prevailing trend, or fighting it?
  • A live HUD panel tells you the trend state and exactly how far price is from the POC in pips.

Key settings: lookback window length, number of price bins (resolution), POC smoothing, trend filter EMA period, and full colour customisation for both the bullish/bearish blend and the POC line.

Typical use cases: spotting whether a support/resistance zone was built on genuine buying or selling pressure rather than just raw volume; using POC as a dynamic fair-value magnet; confirming whether volume at the current level agrees with or contradicts the prevailing trend; combining with your own entry model as a volume-context filter.

Best suited for: intraday traders on forex majors, gold, and indices who want more than a flat volume bar or a single-colour heatmap — useful as a standalone read or as confluence alongside structure-based setups.

Summary

AI summary
Impulse Heatmap is a directional volume heatmap indicator designed to analyze tick volume distribution across price zones with a focus on volume direction—buying versus selling—rather than just volume intensity. It segments volume into price bins similar to a volume profile but colors each bin based on the proportion of bullish-closing versus bearish-closing candle volume. Zones with predominantly bullish volume appear green, indicating accumulation or potential support, while zones with mostly bearish volume appear red, indicating distribution or potential resistance. Mixed zones show blended colors.

Key features include:
- Bright, saturated zones highlighting high volume concentration price levels.
- A gold Point of Control (POC) line representing a smoothed volume center of gravity as a dynamic fair value reference.
- A white trend filter EMA providing context on whether volume zones align with or oppose the prevailing trend.
- A live HUD panel displaying trend state and price distance from the POC in pips.
- Customizable settings for lookback window, price bin resolution, POC smoothing, trend filter EMA period, and color schemes.

Impulse Heatmap is suited for intraday traders focusing on forex majors, gold, and indices who require enhanced volume context to distinguish genuine buying or selling pressure at key support and resistance levels. It can be used standalone or combined with other structural or entry models.
Indicator profile
Indicator category
Trend
Output type
Signals
Visualisation
Data requirements
Bars only
Tick data
Supported signals
Breakout
Reversal
Trend strength
Volatility
Session opening range
Divergence

Customer reviews

0.0
Reviews: 0
Customer reviews
No reviews for this product yet. Already tried it? Be the first to tell others!

Discussion

FAQ

EMA
Key Levels
AI-assisted
BOS
Volume
Market Structure
Support & Resistance
Products available through cTrader Store, including trading bots, indicators and plugins, are provided by third-party developers and made available for informational and technical access purposes only. cTrader Store is not a broker and does not provide investment advice, personal recommendations or any guarantee of future performance.

More from this author

Indicator
AI-assisted
Order Block
+5
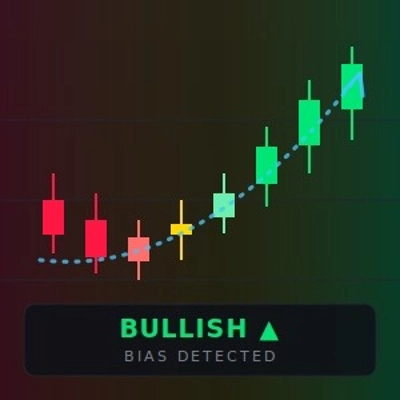
The daily bias estimator indicator uses ICT concepts to show whether the chart is bullish or bearish on multi-time frame
Indicator
ATR
BOS
+5
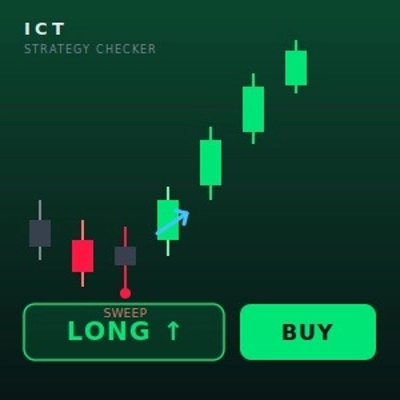
Full ICT/SMC 4-step setup checker that alerts a long or short setup.
Indicator
Volume
Fibonacci
+5
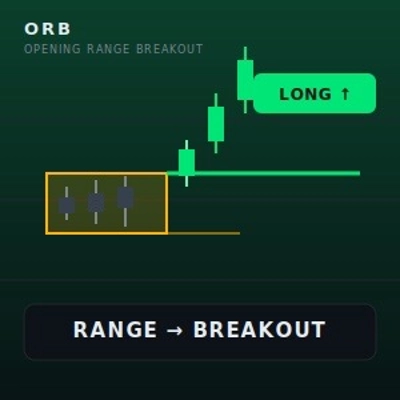
Classic 9:30 Opening Range Breakout — auto-plots the range, flags volume-confirmed breakouts long or short, live.
Indicator
Flag
VWAP
+5
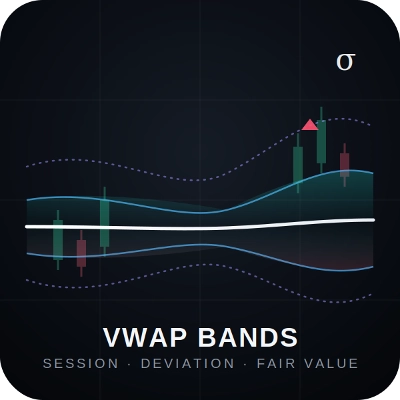
Session VWAP with statistical deviation bands, gradient cloud, and live rejection alerts — see exactly how stretched pri
Indicator
MSS
AI-assisted
+5
Live ICT Silver Bullet detection: liquidity sweeps, structure shifts, and killzone-gated FVGs, graded and glowing in rea
Indicator
ATR
Key Levels
+5
CPR indicator that actually predicts the day ahead: width percentile scoring for breakout-day detection
Indicator
Triangle
Double Top
+5
Know which liquidity sweeps are real. Auto-tracks EQH/EQL and confirms genuine reversals, not just broken levels.
Indicator
ATR
MSS
+5
Grades ICT Unicorn setups (Breaker Block + FVG confluence) into PRIME / SETUP / WATCH, with retest & RR targets.
Indicator
BOS
Volume
+5
20/40/60-day IPDA lookback ranges, Premium/Discount/Equilibrium zones, and quarterly shift alerts — anchored to true dai
Indicator
BOS
MSS
+5
One indicator, full ICT/SMC picture — structure, OBs, FVGs, liquidity, Premium/Discount — with graded PRIME/SETUP signal
Indicator
ATR
Volume
+5
Order blocks with measured hold-rate stats and confidence scoring — not just zones on a chart.
Indicator
BOS
CHOCH
+5
BOS/CHoCH signals confirmed by liquidity sweep + FVG confluence, with a live conviction score.

You may also like

Indicator
Prop
Forex
+4
Automatic Support/Resistance zones from swing points.
Indicator
ADX
ATR
+5
Identifies TRENDING, RANGING and VOLATILE markets with pullback detection. Anti-noise filter. Works on ANY chart.
"AutoAVWAP" logo
Top-rated
4.5
(4)
$19
/
$25
Indicator
Prop
VWAP
+11
The best automatic anchored VWAP indicator every trader can get help from.
Indicator
MACD
Forex
+6
Auto Signal BUY SELL is a professional decision-making tool designed to help you follow the trend and capture high-proba
Indicator
Forex
BTCUSD
+9
Market Sentiment Pro: Predict tops & bottoms using crowd psychology. Contrarian signals with 70-80% accuracy. Early Acce
Indicator
RSI
RSI on the main chart with 45/55 momentum levels, overbought/oversold levels, averaged RSI, and multi-timeframe support.
Indicator
AI
Grid
+17
BORIS Easy Trend: Relax & scalp with 6-TF alignment. Clear BUY/SELL signals & movable UI/HUD make trading effortless.
Indicator
Doji
Volume
+5
Instantly spot high-liquidity institutional moves with clean, non-obtrusive triangle alerts on cTrader charts.
"ORB v1.1" logo
Popular
4.0
(4)
$25
Indicator
Breakout
Opening Range Breakout v1.1 - Visuals + Stats
Indicator
Signal
Breakout
+1
Bolliger Bands + Hamster-Coder™ Timeframe Decoupling
Indicator
MCDX is a powerful and innovative indicator.
"Dem" logo
Top-rated
4.2
(4)
$20
Indicator
Forex
BTCUSD
+5
Scalping indicator for Renko 100 using EMAs to show trend and entry zones with clear colored rectangles.
Indicator
ATR
BOS
+5
Clean Smart Money zones with filtered FVGs, confirmed BOS, Order Blocks, and automatic mitigation tracking.
Indicator
ATR
RSI
+1
Super Trend Rsi ,ATR + trend change distance + dynamic Alpha, divergence/convergence
Indicator
It draws a step line that visualize the movement of H4. Particularly effective when trade on lower timeframe.
Indicator
RSI
Stochastic
+2
Composite mean-reversion oscillator merging Z-Score, RSI & Bollinger %B into one clear overbought/oversold signal.
Indicator
VWAP
Volume
+3
Don't trust static support and resistance levels, this indicator combines Fibonacci and VWAP in one powerful tool.
Indicator
ATR
RSI
+19
Multi-timeframe heatmap scoring Direction, Strength & Volatility at a glance!

Price

Since 07/05/2026
5
Sales
63
Free installs