


Beschreibung
Die größten Bewegungen auf jedem Markt beginnen nicht mit einer großen Kerze – sie beginnen ruhig. Der Preis wickelt sich in eine enge Spanne, die Volatilität zieht sich zusammen, und eine Weile passiert fast nichts. Dann schießt er los. Die meisten Trader bemerken es erst, wenn die Ausbruchskerze schon halb vorbei ist, weil auf ihrem Chart die Wickelphase von Anfang an nicht angezeigt wurde.
Coil Radar basiert genau auf dieser Lücke. Es misst die Breite der Bollinger-Bänder im Vergleich zu einem Keltner-Kanal – wenn Bollinger innerhalb von Keltner zusammengedrückt wird, komprimiert sich der Markt. Je enger diese Kompression wird, desto höher steigt Ihr Coil-Tension-Wert. Wenn der Preis schließlich aus der Kompression ausbricht, zeigt der Indikator die Freigabe an und sagt Ihnen, in welche Richtung er geschossen ist, indem er die zugrunde liegende Dynamik nutzt.
**Kernfunktionen:**
- Bollinger-inside-Keltner Squeeze-Erkennung – die bewährte Methode zur Identifizierung von Volatilitätskompression
- Live Coil Tension %-Anzeige – 0 % bedeutet weit geöffnet, 100 % bedeutet maximal komprimiert und kurz vor dem Ausbruch
- Automatische Ausbruchserkennung in dem Moment, in dem die Kompression freigegeben wird, farbcodiert bullisch oder bärisch basierend auf der Dynamik
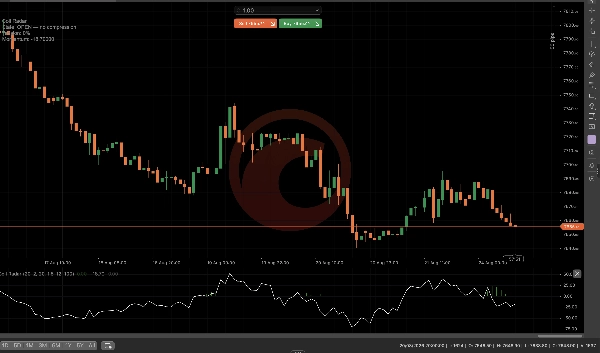
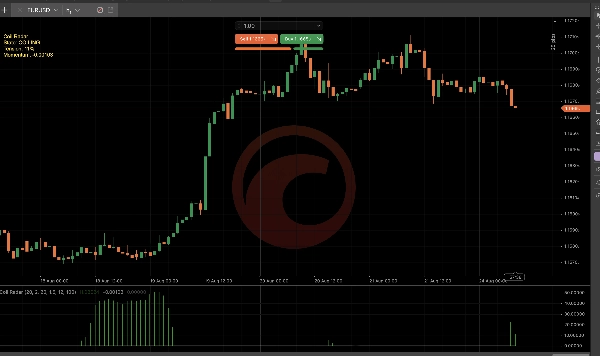
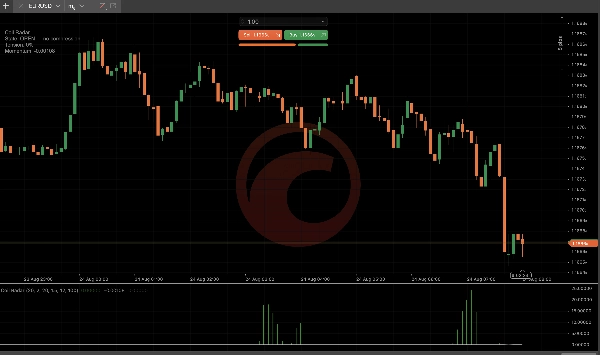
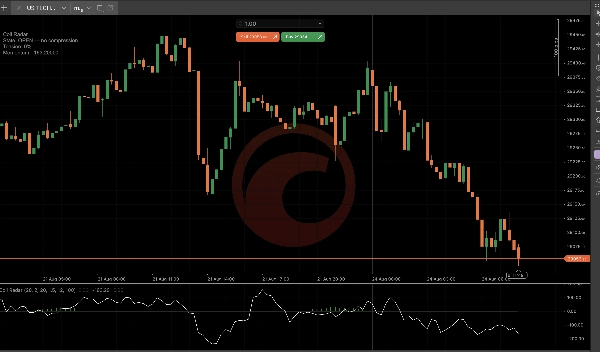
- Drei-Zustände-Visuelles Histogramm: gewickelt (gold), ausbrechend (grün/rot) und offen/keine Kompression (grau) – so können Sie auf einen Blick erkennen, ob Sie beobachten, warten oder schon zu spät sind
- Dashboard direkt im Chart, das den aktuellen Zustand, die Spannung % und die Dynamikanzeige zeigt
- Vollständig konfigurierbare Bollinger- und Keltner-Perioden, Multiplikatoren und Momentum-Rückblick
Dies ist kein Trend- oder Umkehrwerkzeug – es ist ein Frühwarnsystem für die ruhige Phase, bevor die Volatilität zunimmt. Verwenden Sie es, um zu wissen, wann Sie anfangen sollten, aufmerksam zu sein, bevor die Bewegung beginnt, die alle anderen erst bemerken, wenn sie bereits im Gange ist.
Zusammenfassung
Kundenbewertungen
Diskussion
Häufig gestellte Fragen (FAQ)
Mehr von diesem Autor






























Preis