
Frac Support Resistance V1
Indikator
2 käufe
Version 1.0, Nov 2025
Windows, Mac
5.0
Bewertungen: 1
Beschreibung
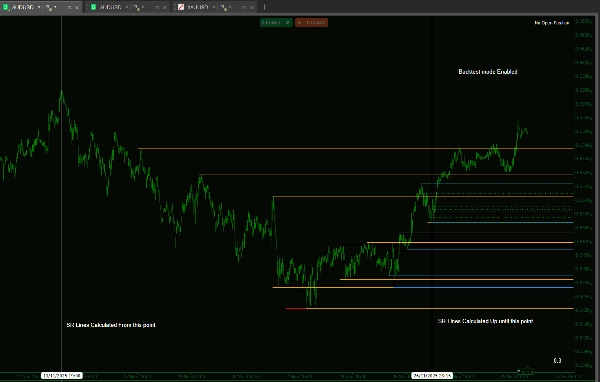
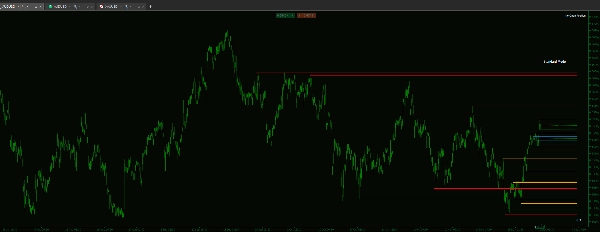
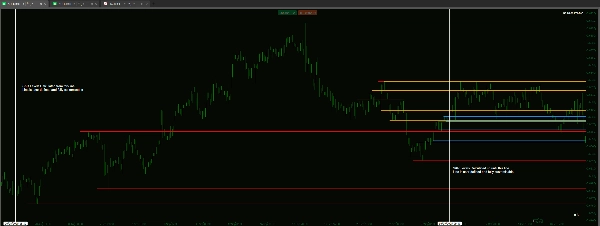
Wenn Sie auf Basis der Marktstruktur handeln, wissen Sie, dass die wichtigsten Niveaus oft auf einem höheren Zeitrahmen gesetzt werden. Dieser benutzerdefinierte Indikator löst die Frustration, diese Niveaus manuell zu identifizieren und zu verfolgen.
Dieses Tool wurde entwickelt, um eine zuverlässige visuelle Hierarchie bereitzustellen, damit Sie kritische strukturelle Grenzen sehen und wertvolle Zonen priorisieren können, ohne Ihren Ausführungsbildschirm zu verlassen.
Hauptmerkmale & Feine Steuerung
- Der Indikator ist für außergewöhnliche Leistung und saubere Chart-Visualisierung entwickelt:
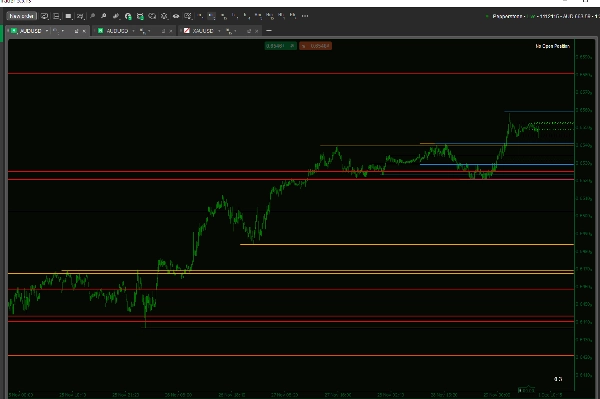
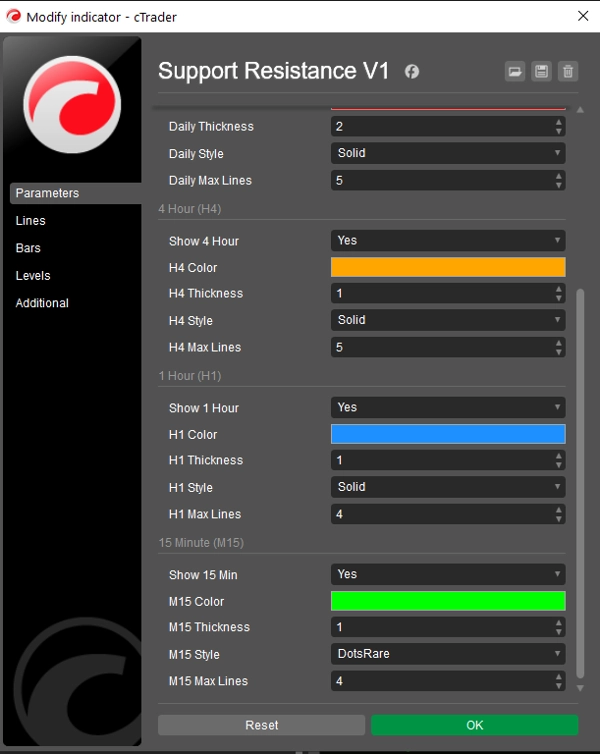
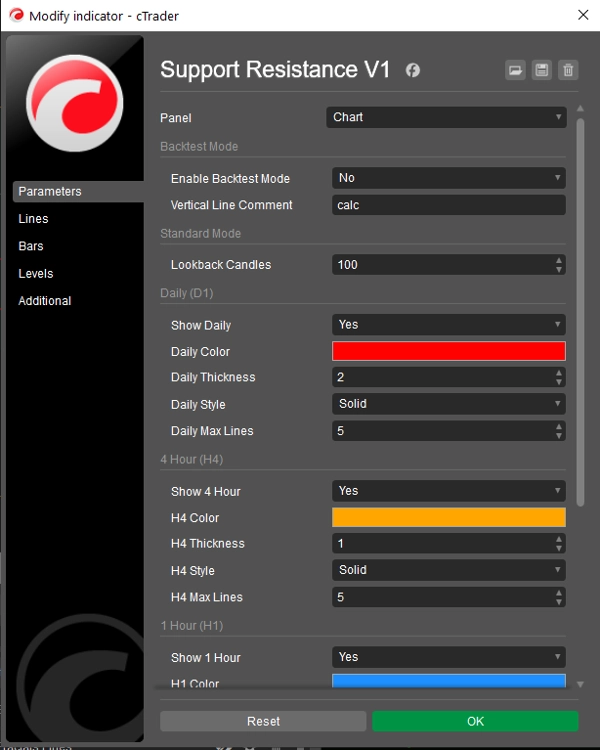
- Echte visuelle Hierarchie: Erhalten Sie unabhängige Kontrolle über Dicke, Linienart (durchgezogen, gestrichelt, gepunktet) und Farbe für jeden einzelnen Zeitrahmen.
- Vorteil: Erkennen Sie sofort die Stärke eines Niveaus allein durch sein Aussehen (z. B. setzen Sie D1-Linien auf dick/durchgezogen für Hauptstrukturen und H1-Linien auf dünn/gepunktet für unmittelbare Niveaus).
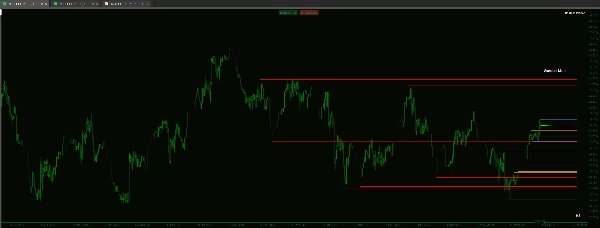
- Leistungs- & Fokussteuerung: Müde von überladenen Charts? Sie können die maximale Anzahl der angezeigten Linien für jeden Zeitrahmen individuell begrenzen.
- Beispiel: Setzen Sie H4 Max Linien auf 5 und D1 Max Linien auf 15, um jüngste Niveaus auf niedrigeren Zeitrahmen zu priorisieren und gleichzeitig einen tieferen Überblick über Hauptstrukturen zu behalten.
- Saubere Codebasis: Basierend auf zuverlässiger Fraktal-Logik, die sicherstellt, dass die identifizierten Niveaus echte Hoch-/Tief-Pivots sind, die in der Standard-Strukturanalyse verwendet werden.
- Dedizierter Backtesting-Modus: Enthält eine Funktion, um die Analyse des Indikators auf einen bestimmten, definierten Zeitraum im Chart zu beschränken. Dies ist essenziell für genaues manuelles Backtesting, indem der Zeitverlauf ohne zukünftige Verzerrung simuliert wird.
Zusammenfassung
KI-Zusammenfassung
Frac Support Resistance V1 is a technical indicator designed to automatically calculate and display smart support and resistance lines derived from multiple timeframes: daily (D1), 4-hour (H4), hourly (H1), and 15-minute (M15). It assists traders who rely on market structure by visually highlighting critical price levels established on higher timeframes, reducing the need for manual identification.
Key features include customizable visual hierarchy, allowing independent adjustment of line thickness, style (solid, dashed, dotted), and color for each timeframe. This enables quick recognition of the relative strength of support and resistance levels. Users can also control chart clarity by setting maximum numbers of lines per timeframe to prioritize recent or major structural levels.
The indicator is based on fractal logic to identify genuine high and low pivots consistent with standard market structure analysis. It includes a dedicated backtesting mode that restricts analysis to a specified historical period, facilitating unbiased manual strategy testing by simulating real-time progression.
Frac Support Resistance V1 supports various markets including Forex, cryptocurrencies, commodities, indices, and stocks, with tags indicating compatibility with symbols like BTCUSD, EURUSD, GBPUSD, XAUUSD, NAS100, and USDJPY. The tool is suited for strategies involving breakout, scalping, smart money concepts, and grid trading.
Indikatorprofil
Kundenbewertungen
5.0
Bewertungen: 1
5 | 100 % | |
4 | 0 % | |
3 | 0 % | |
2 | 0 % | |
1 | 0 % |
Kundenbewertungen
December 1, 2025
A small account test feels safer, and the plan becomes easier to stick with, and the chart still needs a final look.
Diskussion
Häufig gestellte Fragen (FAQ)
BTCUSD
Forex
Signal
Breakout
Indices
EURUSD
Commodities
GBPUSD
NZDUSD
Prop
Scalping
SMC
Crypto
Grid
Stocks
AI
XAUUSD
NAS100
USDJPY
Über den cTrader Store verfügbare Produkte, einschließlich Handelsbots, Indikatoren und Plugins, werden von externen Entwicklern bereitgestellt und nur zu Informations- und technischen Zugriffszwecken verfügbar gemacht. cTrader Store ist kein Broker und erbringt keine Anlageberatung, persönlichen Empfehlungen oder eine Garantie für zukünftige Performance.


Preis
Seit 14/01/2025
55
Verkäufe
11.37K
Kostenlose Installationen