

HIGHS LOWS AEGIS
Indikator
1 käufe
Version 1.0, Dec 2025
Windows, Mac
4.6
Bewertungen: 3
Seit 14/04/2025
1
Verkäufe
Beschreibung
Ein einfacher Indikator, der ausgewählte Hochs und Tiefs anzeigt.
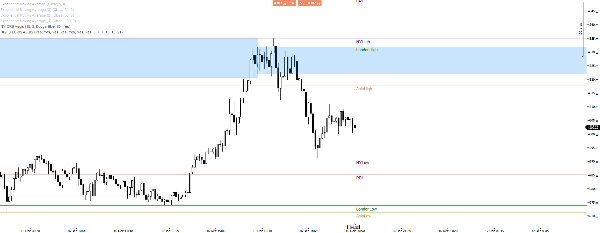
- Tief/Hoch des vorherigen Tages
- Tief/Hoch der vorherigen Woche
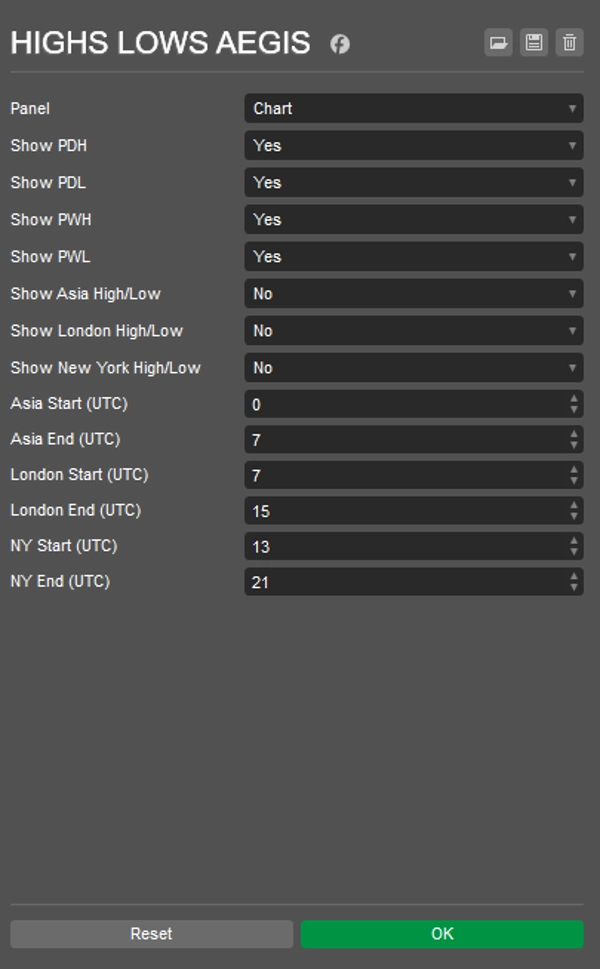
- Tief/Hoch der Asia/London/New York-Sitzungen
- Anpassbare UTC-Zeit für jeden Sitzungsbeginn/-ende
Beschriftete Linien für eine bessere Übersicht, was was ist.
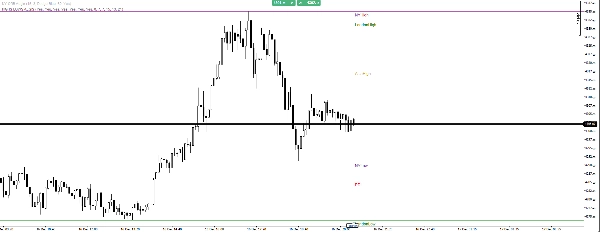
Gute Verwendung mit fast jeder Strategie, ich benutze es mit ORB, was sehr hilft, falsche Ausbrüche zu vermeiden, wie heute auf dem Bild mit XAUUSD.
Zusammenfassung
AI summary
HIGHS LOWS AEGIS is a trading indicator that displays selected high and low price levels on a chart. It shows Previous Day Low/High, Previous Week Low/High, and session-specific lows and highs for Asia, London, and New York trading sessions. Users can customize the UTC start and end times for each session. The indicator features labeled lines to clearly identify each level. It is designed to be compatible with various trading strategies, including opening range breakout (ORB), and can assist in identifying potential breakout points and avoiding false breakouts. The indicator supports multiple markets such as Forex, commodities, indices, and stocks, and is applicable to symbols including EURUSD, XAUUSD (gold), and NAS100 (Nasdaq 100).
Indikatorprofil
Kundenbewertungen
4.6
Bewertungen: 3
5 | 67 % | |
4 | 33 % | |
3 | 0 % | |
2 | 0 % | |
1 | 0 % |
Kundenbewertungen
December 27, 2025
December 24, 2025
weak ideas are easier to skip, but it should stay in the support stack.
December 21, 2025
Diskussion
Häufig gestellte Fragen (FAQ)
Prop
Forex
Breakout
Scalping
Indices
EURUSD
Commodities
SMC
Stocks
XAUUSD
NAS100
Über den cTrader Store verfügbare Produkte, einschließlich Handelsbots, Indikatoren und Plugins, werden von externen Entwicklern bereitgestellt und nur zu Informations- und technischen Zugriffszwecken verfügbar gemacht. cTrader Store ist kein Broker und erbringt keine Anlageberatung, persönlichen Empfehlungen oder eine Garantie für zukünftige Performance.
















Preis
Seit 14/04/2025
1
Verkäufe