
Deskripsi
═══════════════════════════════════════════════════════════════
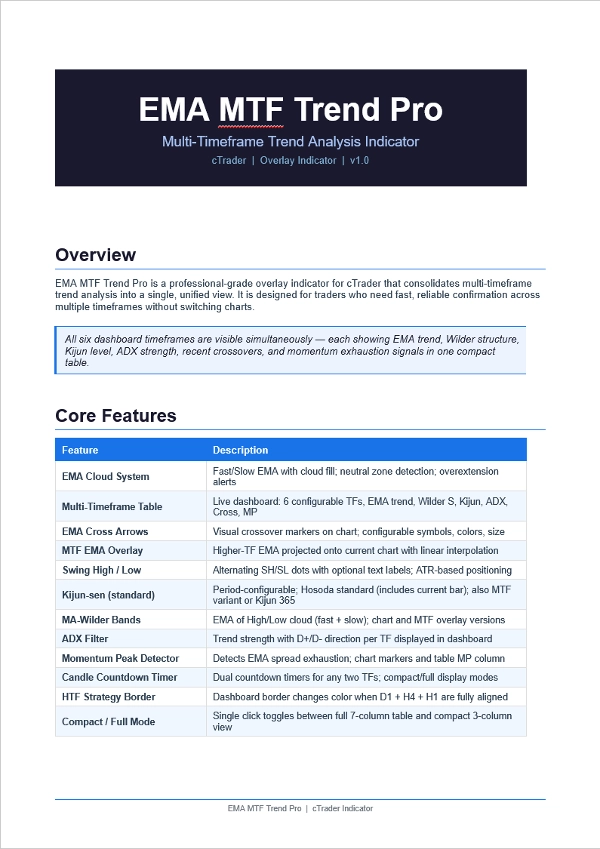
EMA MTF TREND PRO — Indikator Analisis Tren Multi-Timeframe
Indikator Overlay cTrader
═══════════════════════════════════════════════════════════════
Lihat gambaran tren lengkap di 6 timeframe — dalam satu tabel,
di satu grafik, tanpa harus berganti jendela.
───────────────────────────────────────────────────────────────
APA YANG DILAKUKANNYA
───────────────────────────────────────────────────────────────
EMA MTF Trend Pro menggabungkan arah tren EMA, struktur saluran Wilder,
level Kijun-sen, kekuatan ADX, sinyal crossover,
dan kelelahan momentum ke dalam satu dashboard langsung.
Setiap baris dalam tabel adalah timeframe yang berbeda. Setiap kolom
menjawab pertanyaan berbeda tentang timeframe tersebut. Sekilas
memberitahu Anda apakah timeframe setuju — dan apakah aman untuk
masuk.
───────────────────────────────────────────────────────────────
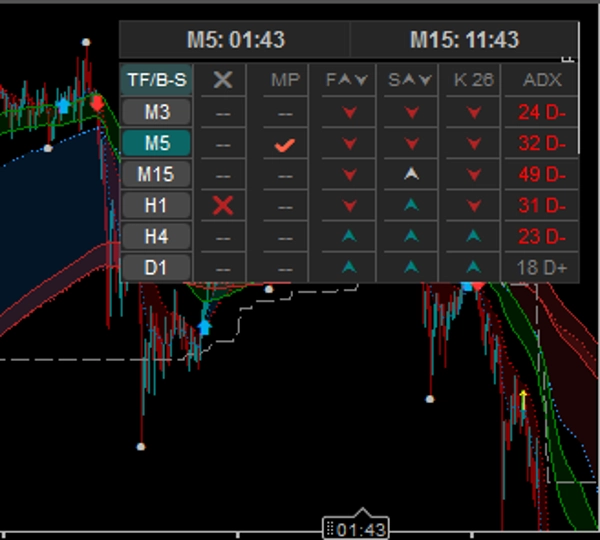
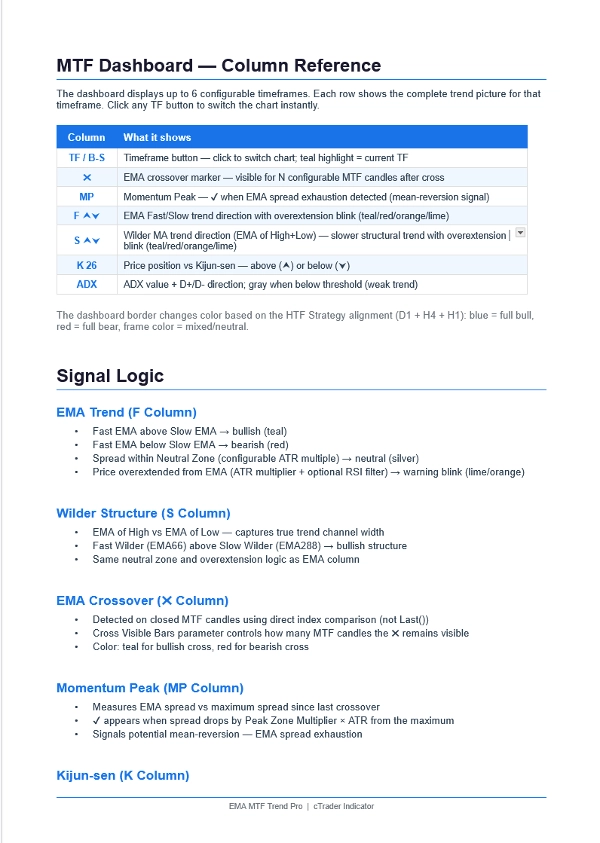
DASHBOARD — 6 TIMEFRAME × 7 KOLOM
───────────────────────────────────────────────────────────────
Kolom Apa yang ditampilkan
──────── ──────────────────────────────────────────────────
TF/B-S Tombol timeframe — klik untuk mengganti grafik secara instan
Sorotan teal = timeframe yang sedang ditampilkan
✖ Crossover EMA — terlihat untuk N candle yang dapat dikonfigurasi
Teal = cross bullish | Merah = cross bearish
MP Puncak Momentum — ✔ saat spread EMA habis
Sinyal peringatan mean-reversion
F ⮝⮟ Arah tren EMA Cepat vs Lambat
Teal = naik | Merah = turun | Perak = netral
Berkedip saat harga terlalu jauh dari EMA
S ⮝⮟ Struktur MA Wilder (EMA dari High/Low)
Filter tren yang lebih lambat dan lebih struktural
K 26 Harga vs Kijun-sen
⮝ = harga di atas (support) | ⮟ = di bawah (resistance)
ADX Kekuatan tren + arah D+/D-
Abu-abu = pasar lemah/sideways (di bawah ambang)
───────────────────────────────────────────────────────────────
FITUR
───────────────────────────────────────────────────────────────
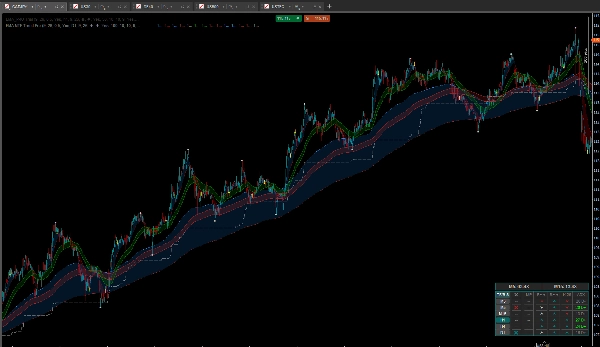
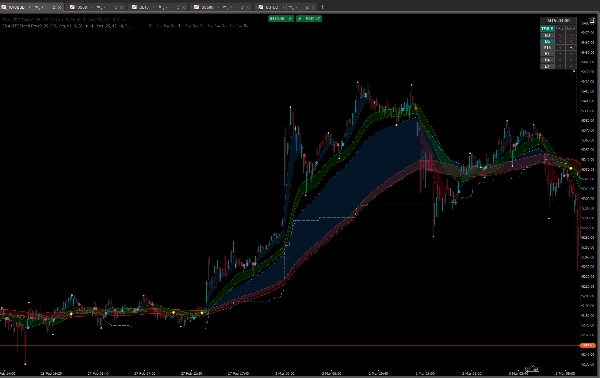
SISTEM AWAN EMA
• EMA Cepat + Lambat dengan isi awan berwarna
• Deteksi zona netral (pengali ATR yang dapat dikonfigurasi)
• Peringatan overextension dengan filter RSI
OVERLAY EMA MTF
• Proyeksikan EMA TF lebih tinggi ke grafik saat ini
• Interpolasi linier — garis halus, tanpa langkah
• Panah crossover dengan simbol dan warna yang dapat dikonfigurasi
• Otomatis menyembunyikan panah overlay saat TF lebih tinggi dipilih
di dashboard (mencegah kekacauan visual)
PUNCAK & LEMAH SWING
• Titik SH / SL bergantian — tidak ada puncak berturut-turut yang duplikat
• Label teks SH / SL opsional dengan posisi berbasis ATR
• Ukuran titik, ukuran label, warna yang dapat dikonfigurasi
• Saklar on/off tunggal untuk seluruh tampilan swing
KIJUN-SEN
• Definisi standar Hosoda (sesuai TradingView / MT4)
• Periode yang dapat dikonfigurasi
• Juga tersedia sebagai garis overlay MTF di grafik
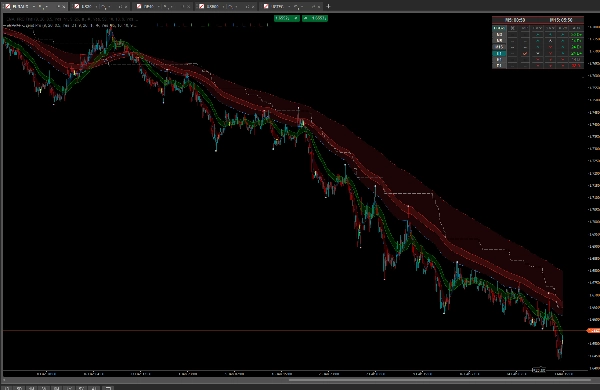
MA-WILDER BANDS
• EMA dari High dan EMA dari Low — membuat saluran tren
• Band Cepat (EMA66) + Band Lambat (EMA288)
• Tersedia di grafik dan sebagai overlay MTF
BATAS STRATEGI HTF
• Batas dashboard berubah menjadi teal saat D1 + H4 + H1
semuanya bullish (EMA + Wilder selaras)
• Berubah merah saat ketiganya bearish
• Konfirmasi visual instan dari keselarasan multi-TF penuh
TIMER HITUNG MUNDUR CANDLE
• Timer ganda — dua timeframe apa saja
• Timer kedua dapat mengikuti TF grafik saat ini
• Tata letak kompak dalam mode kolom tunggal
MODE KOMPAK / PENUH
• Klik header TF/B-S untuk beralih
• Mode penuh: 7 kolom (semua sinyal)
• Mode kompak: 3 kolom (TF, EMA, Wilder) — ruang minimal
───────────────────────────────────────────────────────────────
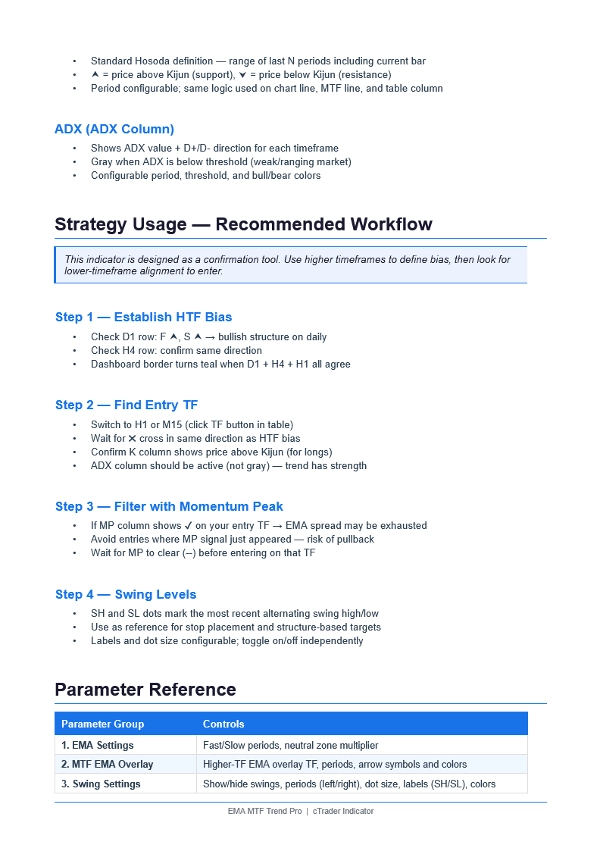
STRATEGI — CARA MENGGUNAKAN
───────────────────────────────────────────────────────────────
LANGKAH 1 — TETAPKAN BIAS (Timeframe Lebih Tinggi)
• Baris D1: F ⮝ + S ⮝ = struktur harian bullish
• Baris H4: arah sama = tren terkonfirmasi
• Batas dashboard berubah menjadi teal = D1 + H4 + H1 semua setuju
LANGKAH 2 — TEMUKAN ENTRY (Timeframe Lebih Rendah)
• Klik H1 atau M15 di tabel untuk mengganti grafik
• Tunggu ✖ cross dengan arah yang sama dengan bias HTF
• Kolom K menunjukkan ⮝ (harga di atas Kijun) untuk posisi long
• Kolom ADX aktif, tidak abu-abu (tren memiliki kekuatan)
LANGKAH 3 — SARING DENGAN PUNCAK MOMENTUM
• Kolom MP menunjukkan ✔ → spread EMA habis → hindari entry
• Tunggu MP hilang (--) sebelum masuk
• Gunakan di TF lebih rendah untuk menghindari entry di ekstrem EMA
LANGKAH 4 — GUNAKAN LEVEL SWING
• Titik SH = swing high terbaru (resistance / referensi stop)
• Titik SL = swing low terbaru (support / referensi target)
• Titik bergantian — selalu satu high, satu low pada satu waktu
───────────────────────────────────────────────────────────────
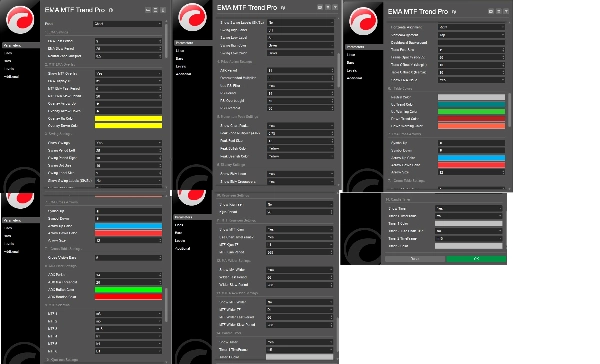
GRUP PARAMETER
───────────────────────────────────────────────────────────────
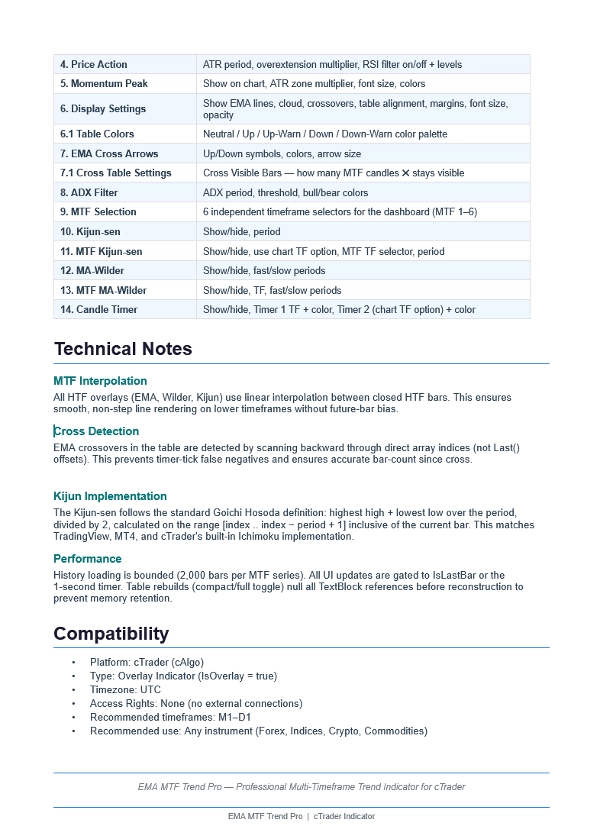
1. Pengaturan EMA — periode Cepat/Lambat, zona netral
2. Overlay EMA MTF — TF, periode, gaya panah
3. Pengaturan Swing — Tampilkan/sembunyikan, periode, label, warna
4. Aksi Harga — ATR, overextension, filter RSI
5. Puncak Momentum — Pengali zona, font, warna
6. Pengaturan Tampilan — Garis, awan, tata letak tabel
6.1 Warna Tabel — Kontrol palet warna penuh
7. Panah Cross EMA — Simbol, warna, ukuran
7.1 Pengaturan Tabel Cross — Cross Visible Bars (N candle)
8. Filter ADX — Periode, ambang, warna
9. Seleksi MTF — 6 × pemilih TF independen
10. Kijun-sen — Tampilkan/sembunyikan, periode
11. Kijun-sen MTF — TF, periode, opsi TF grafik
12. MA-Wilder — Tampilkan/sembunyikan, periode cepat/lambat
13. MA-Wilder MTF — TF, periode cepat/lambat
14. Timer Candle — TF, warna, opsi TF grafik
───────────────────────────────────────────────────────────────
Ringkasan
Ulasan pelanggan
5 | 0 % | |
4 | 100 % | |
3 | 0 % | |
2 | 0 % | |
1 | 0 % |


